See how to use the ExternalControlIO server to set up CDP for logging sensor (signal) data to a external cloud database for archiving and later analysis (querying). It shows how to add HTTPRequest and HTTPSubRequest to your system and how to configure them for interacting with REST service.
Create cloud database account and database
In order to use a cloud database you have to choose one of them and create a user in that database. There are many cloud databases available with different service and price levels. Almost all of them provide REST API for remote usage from different systems. As the REST protocol is based on the HTTP protocol you can also use these databases from CDP using HTTPRequest.
For this example we choose restdb.io cloud database service. To follow this guide you need to create a free account (or use an existing account) at the restdb.io cloud service.
After the account is created, log into restdb.io and create a database for your signal values by clicking Create New. Name your database and click Go. After that you will automatically be logged into your database console. Click the Developer mode button in the right upper corner to get all configuration options visible.
Now add a collection (i.e. database table) for your sensor data by clicking Collections +. Name your new collection f.e. temperatures and click Save. Then click on the new collection name to open its configuration panel. In the tab Fields add a new field (i.e. table column) named temperature with type number_float.
Now your temperature cloud database is prepared. Open tab “API Docs” -> “cURL” for your REST access information (your database URL and APIKey) – we will need this information later to configure CDP HTTPRequest.
Add test temperature signal to your system
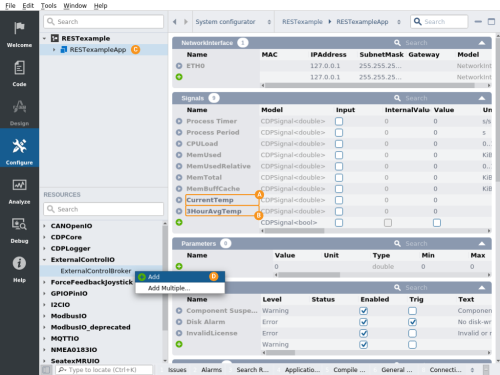
Usually you have signals to log and watch already existing in your system. For this example, we create two CDPSignal<double> output signals called CurrentTemp and 3HourAvgTemp.
Add ExternalControlBroker to your system
Now, follow these steps to add the ExternalControlBroker.HTTPRequest to the CDP system which needs to make REST queries to your cloud database:
- Click on application name
- Choose a ExternalControlBroker from Resource tree and click Add to add ExternalControlBroker to the application
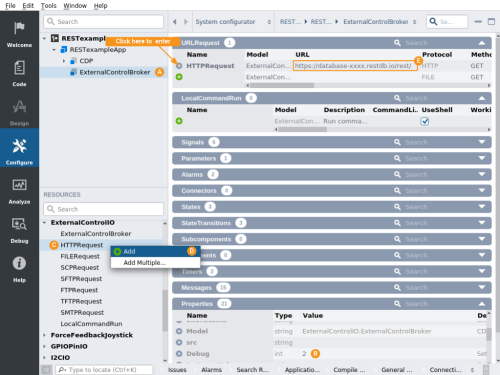
Add HTTPRequest to ExternalControlBroker
Follow these steps:
- Click on added ExternalControlBroker component
- Set Debug property to 2 (to see informative log entries later, during system run)
- Choose a HTTPRequest from Resource tree and click Add to add HTTPRequest to your system into the ExternalControlBroker IOServer
- Acquire the REST API base URL from restdb.io “API Docs” -> “cURL” pane and set URL property accordingly to look something like https://database-xxxx.restdb.io/rest/
- Click on the play button next to HTTPRequest to enter into it for further configuration
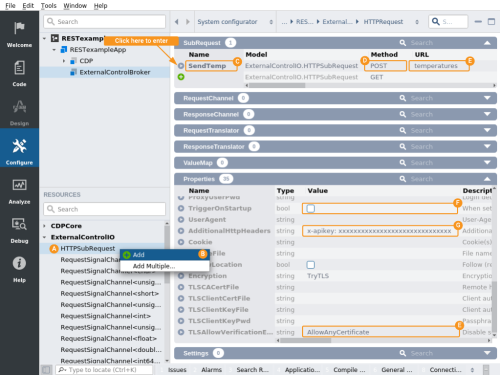
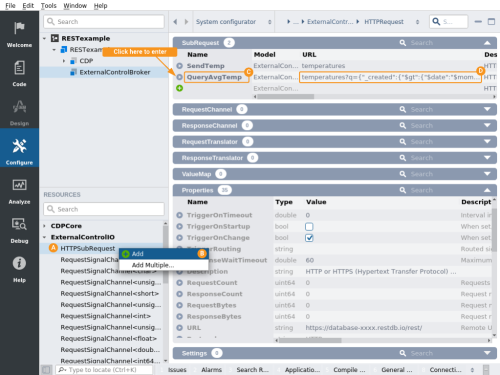
Configure parent HTTPRequest and add HTTPSubRequest for temperature sending
- Choose a HTTPSubRequest from Resource tree and click Add to add it to the base HTTPRequest
- Rename it to be SendTemp
- Set Method to be POST
- Set URL to be temperatures
- Acquire the REST secret APIKey restdb.io “API Docs” -> “cURL” pane and set HTTPRequest AdditionalHTTPHeaders accordingly to look like x-apikey: xxxxxxxxxxxxxxxxxxxxxxxxxxxxxx
- Click on the play button next to SendTemp to enter into it for further configuration
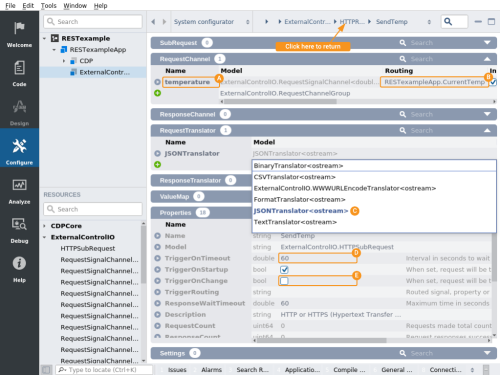
Configure temperature sender HTTPSubRequest
- Add RequestSignalChannel<double> to RequestChannel table and name it to be temperature
- Set Routing to point to the corresponding temperature signal you created earlier
- Add a RequestTranslator by clicking on the model list and then choosing JSONTranslator<ostream>
- Set TriggerOnTimeout to be 60 (seconds)
- Unset TriggerOnChange property
- Clicking on HTTPRequest on navigation breadcrumb to return to HTTPRequest configuration
Add another HTTPSubRequest for average temperature querying
- Choose a HTTPSubRequest from Resource tree and click Add to add it to the HTTPRequest
- Rename it to be QueryAvgTemp
- Set the URL to be a NoSQL average query for temperature average of records inserted during the last 3 hours
temperature?q={“_created”:{“$gt”:{“$date”:”$moment.subtract.3.hours”}}}&h={“$aggregate”:[“AVG:temperature”]} - Click on the play button next to QueryAvgTemp to enter into it for further configuration
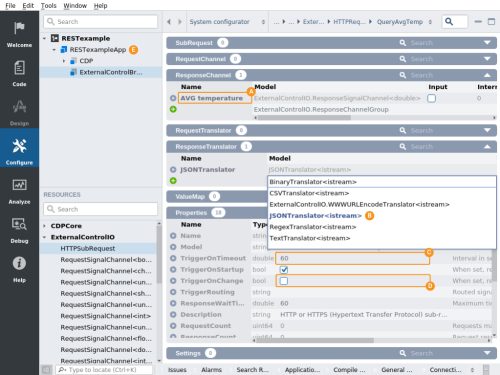
Configure average temperature query HTTPSubRequest
- Add ResponseSignalChannel<double> to ResponseChannel table and name it to be AVG temperature
Note: That name will need to exactly match the tag restdb.io uses in its JSON response - Add a RequestTranslator by clicking on the model list and then choosing JSONTranslator<ostream>
- Set TriggerOnTimeout to be 60 (seconds)
- Unset TriggerOnChange property
- Click on the application name to continue connecting response signal routing
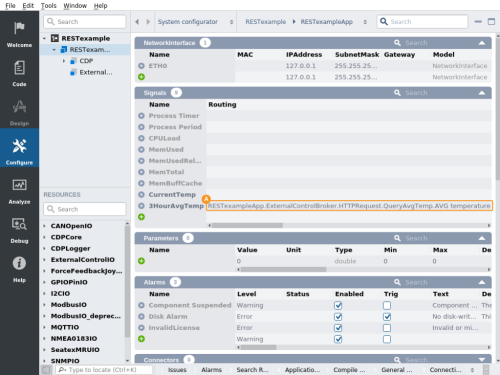
Route average temperature response to signal
- In Signals table locate and set signal 3HourAvgTemp Routing to corresponding HTTPSubRequest response channel to be like this RESTexampleApp.ExternalControlBroker.HTTPRequest.QueryAvgTemp.AVG temperature
Run the system and test your cloud database connection
Now you are ready to run your system and test this cloud database example. Run your system and connect to it. You can inspect that the system is sending temperature to the database and receiving 3h average values back like this:
- Locate and change CurrentTemp signal to some reasonable value.
- Wait a minute and inspect the application output windows to confirm the database post request was sent with log lines like this:
Starting HTTP POST request: https://database-xxxx.restdb.io/rest/temperatures
Received response body: ‘{“_id”:”5b0fcdcbb7e1ba0a00007332″,”temperature”:xx,… - Inspect that the average 3HourAverageTemperature signal is also changing correspondingly. An average temperature query from the database will generate log lines like this:
Starting HTTP GET request: https://database-xxxx.restdb.io/rest/temperatures?q={“_created”:{“$gt”: {“$date”:…
Received response body: ‘{“AVG temperature”:35.78125}’ (length 28)
Further benefits from external logging
Now that you have sensor data logged into the cloud database you can use any tool provided by the database provider (or 3-rd party) to:
- further process collected data
- run complex queries on data
- visualize (graph) data
Please inspect restdb.io manuals for how to create pages / views with graphs etc on the data collected.