• Skip to main content
  • Skip to header right navigation
  • Skip to site footer
CDP Studio logo

CDP Studio

The no-code and full-code software development tool for distributed control systems and HMI

  • Doc
  • Why CDP
    • Software developers
    • Automation engineers
    • Managers
  • Products
    • Automation Designer
    • HMI Designer
    • Maritime HMIs
  • Services
  • Use cases
  • Pricing
  • Try CDP

CDP Studio Documentation

CDP Graph Widgets Classes

GUI - CDP Graph Widgets

CDP Graph Widgets

CDP Graph Widgets are used to plot CDP signals and properties. There are separate widgets for viewing real-time and historical database data. All of them can be dragged into your CDP GUI application.

For more information, see documentation for CDP Graph Widgets Classes.

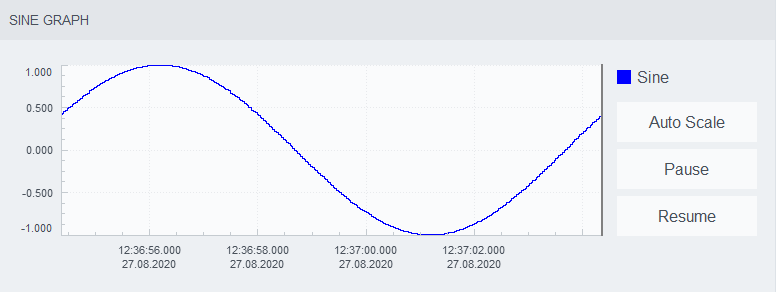
The above example shows a graph with plottingMode set to Scrolling. The legend is hidden and instead the plotted data name is shown in a label to the right. Auto scale, pause and resume are controlled by four ordinary buttons, connected to the widget using signal and slot connections.

CDP Graph Widgets Classes

The content of this document is confidential information not to be published without the consent of CDP Technologies AS.

CDP Technologies AS, www.cdpstudio.com

Get started with CDP Studio today

Let us help you take your great ideas and turn them into the products your customer will love.

Try CDP Studio for free
Why CDP Studio?

CDP Technologies AS
Hundsværgata 8,
P.O. Box 144
6001 Ålesund, Norway

Tel: +47 990 80 900
E-mail: info@cdptech.com

Company

About CDP

Contact us

Services

Partners

Blog

Developers

Get started

User manuals

Support

Document download

Release notes

My account

Follow CDP

  • LinkedIn
  • YouTube
  • GitHub

© Copyright 2025 CDP Technologies. Privacy and cookie policy.

Return to top