Historic Data
Introduction
Historic data can be viewed by either using in-system logger or by loading presaved datastore file.
Presaved datastores can be used to conveniently share and view chuncks of data without having access to the running system. Whereas viewing logger data requires access to the running system.
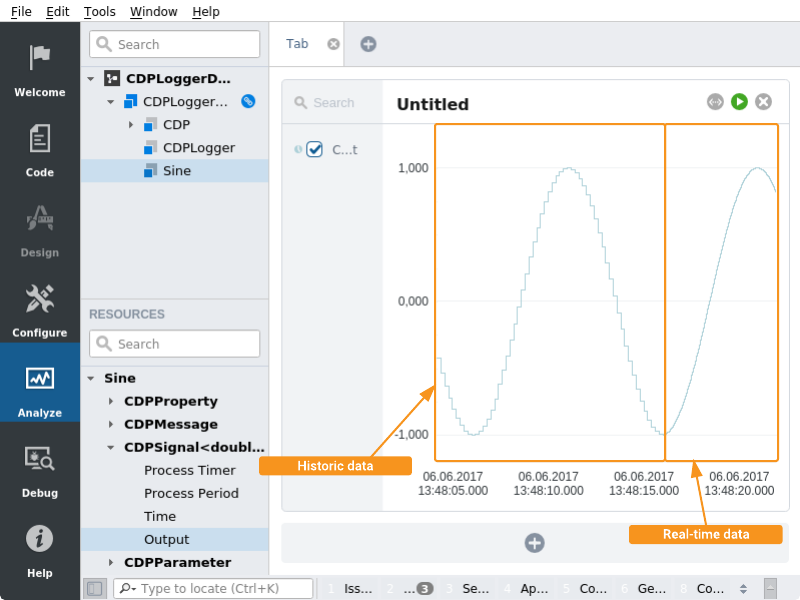
If there is a logger in a system then it is automatically detected when connecting to the system. When plotting a value in the system that is also logged by one of the loggers, then the plotter seamlessly displays historic data together with real-time data. If real-time data is available, then that is shown, else the logged data is shown.
Exporting/Saving Data
CDP Studio supports exporting data into two formats, CSV (comma separated values) and CDP Compact Datastore. The latter can be opened by CDP Studio itself to analyze data. See below how to open saved datastore.
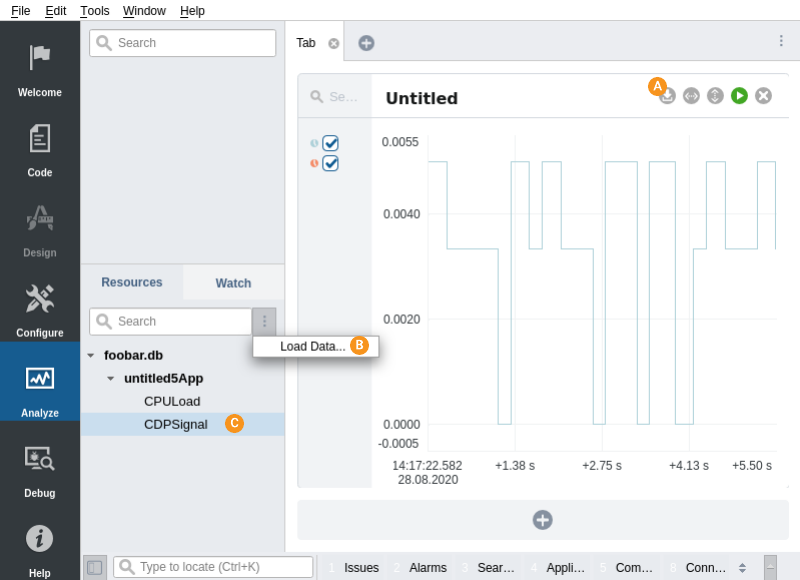
To save the data, click on the Save Data icon on the Graph and specify the location and file format. Note that saving large regions of data can take time due to full resolution data being fetched from the source. This is necessary in order to support zooming into details for later viewing.
Viewing Historic Data Using Exported/Saved Datastore
To view the saved data, click on the Load Data... menu item and specify the file you want to open. Note that only CDP Compact Datastore can be opened by CDP Studio and CSV is not supported.
After successful opening of the file, the Resource tree gets populated with corresponding filename structure. Once this is done, it is possible to add/drag resources to any plot as usual.
When opening a datastore while having items already on the plot, CDP Studio tries to seamlessly resolve history sources that match with opened datasource, so you could use Load Configuration hand in hand with Load Data.

Viewing Historic Data Using In-System Logger
To view logged data with CDP Studio Analyze mode, take the following steps:
- Add a logger into your system and select which values it will log. For more information see the Data Logging manual.
- For this example, make sure to log data values that change during run runtime.
- Click Run on each application (don't Connect yet), and wait a while to make sure some data is logged.
- Select the system, and click Connect.
- Go to Analyze mode and add the logged values to a graph. See Adding Items to Graph.
Now you will see not just the real-time data from when we connected, but also historic values from the logger datastore, from the time before we connected.
To view historic data, you may zoom out on the graph, or pan left.
The following image shows a sine signal that had been logged with low resolution (5 Hz). From the moment CDP Studio starts plotting the signal, data with highest resolution is requested and both historic and real-time data are displayed on the same graph.

Selecting History Source
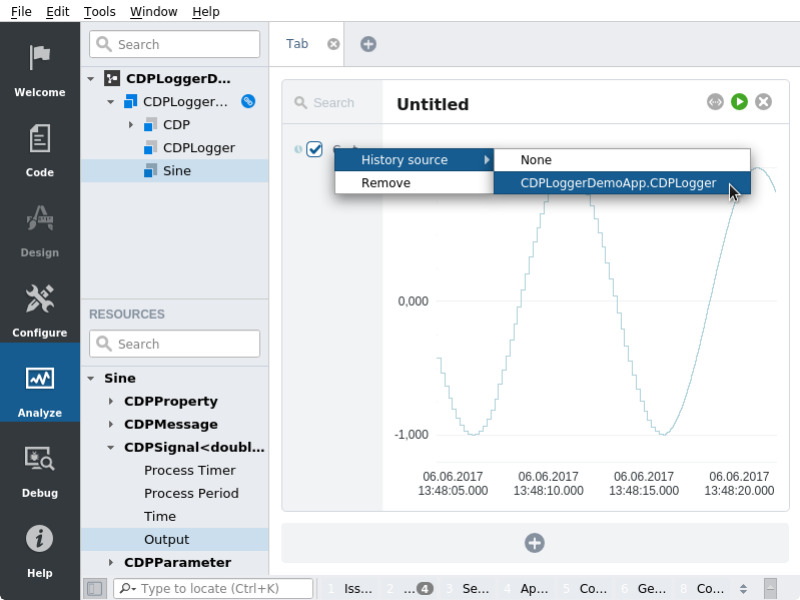
If the plotted value has multiple data sources, you may select which one to display. This can happen when:
- There are multiple loggers in the system logging the same value. For example one logging it with 1000 Hz frequency and keeping history for 1 hour, other logging with 1 Hz for one month.
- Same value is added to one logger twice, perhaps logged with different parameters.
- Datastore is loaded in a system where also logger is present.
- Data is opened from multiple datastore files containing the same value.
To select a source, right click on a graph legend item and select History source. If the graph legend is hidden, see here for how to show/hide the graph legend.
Note: The graph always prefers real-time source to the history source if both are enabled.

Advanced: Connecting to a Custom IP and Port
While one normally connects to a running system and the logger components are automatically detected, it is also possible to connect to a custom IP and port. This can be useful in cases where the automatic detection fails (e.g. when using manual port forwarding over remote SSH or VPN) or when the network connection is poor and full CDP system connect could overload the network.
To do this:
- Open CDP Studio
- Go to Analyze mode
- In the Resource tree, click on the menu icon next to the search field
- Select Connect Log Server...
- Enter the IP and port of the log server in the format
"127.0.0.1:17000"(the default port is 17000).
Once connected, the available historic data will be shown in the Resource tree and it is possible to add/drag resources to any plot as usual.
Note: To find the IP and port of the log server, check the Application Output pane when starting the logger and look for a printout similar to the following:
CDPLogger: Log server started on 127.0.0.1:17000
Get started with CDP Studio today
Let us help you take your great ideas and turn them into the products your customer will love.