CDP Studio - Debug Mode Manual
Introduction
You can use the CDP Studio Debug mode to inspect the state of your applications while debugging. You can interact with the debugger in several ways, including the following:
- Go through a program line-by-line or instruction-by-instruction.
- Interrupt running programs.
- Set breakpoints.
- Examine the contents of the call stack.
- Examine and modify contents of local and global variables.
- Examine and modify registers and memory contents of the debugged program.
- Examine the list of loaded shared libraries.
- Disassemble sections of code.
- Create snapshots of the current state of the debugged program and re-examine them later.
Debugger Sections
The Debug mode consists of the following sections: Project tree, Open Documents, Code editor, Stack Trace, Breakpoints, Variables.
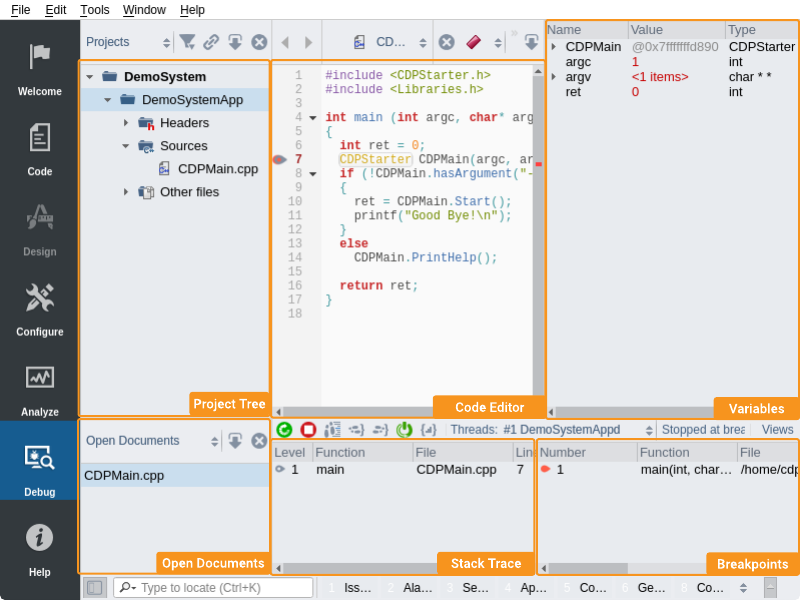
Project tree
This Project tree is the same as in the Code mode. See also CDP Studio - Code Mode Manual.
Open Documents
This section lists the documents that are currently open in CDP Studio.
Code editor
This Code editor is the same as in the Code mode
Stack Trace
This section shows the call stack trace of your program when the execution is interrupted. When the program is interrupted, the debugger shows all the nested functions calls that lead to the current position in the code. Each entry in the list is called a frame. If you click on a frame the text editor will jump to the corresponding location and other relevant sections will then show the information associated with that particular frame.
Breakpoints
This section lists all breakpoints that have been placed in your program. If you click on a breakpoint, the text editor will jump to the corresponding location in the source code. You can right-click a breakpoint to edit it. If you are debugging a component that has multiple instances, you can make the debugger break only on a given instance by specifying the Condition:
strcmp(GetNodeLongName().c_str(),"TrafficLightApp.TrafficLight2")==0
where "TrafficLightApp.TrafficLight2" is replaced with the full name of the component you want to break on. Now, whenever this breakpoint is hit, the debugger will check that the Condition returns true, and if so, it will stop on that breakpoint.
Note: Faulty or non-existing breakpoint-locations may cause the Debugger to fail. If the debugger hangs, or won't start, try to clear all breakpoints in the breakpoint window, then restart the debug session.
Variables
When your program is interrupted, the local variables and their values are shown in this section. This section shows the state that existed at the currently selected Stack Trace frame. You can change the value of the variables by clicking into them and editing them.
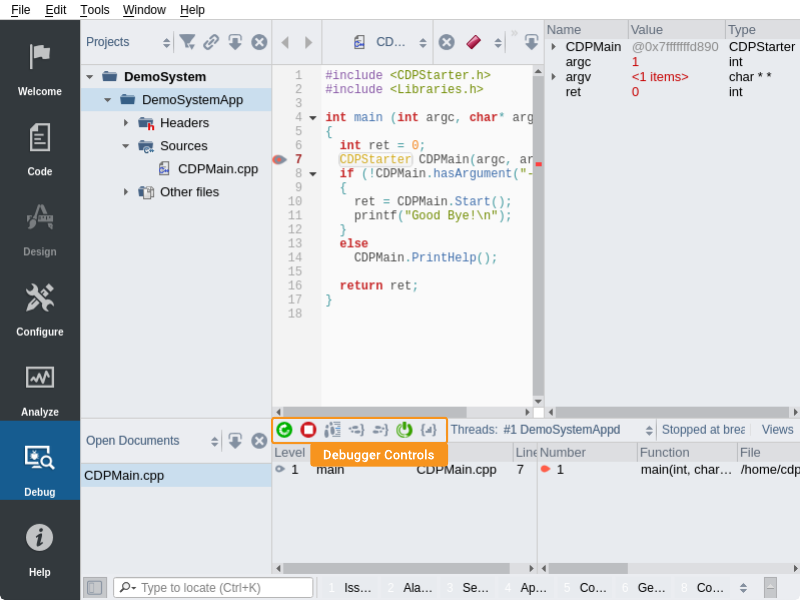
Debugger Controls
The controls in this section allow you to control the execution of the program. You can resume execution or stop it. You can also step into, out of, or over instructions.
Additional information
An in-depth description of the debugger and its features can be found here
To learn more about how to start debugging your CDP applications please refer to the following documentations:
Get started with CDP Studio today
Let us help you take your great ideas and turn them into the products your customer will love.