Understanding the CDP Metrics System
Introduction: What Is the Metrics System?
Imagine a smart factory where new equipment is installed daily. Instead of manually wiring up sensors for temperature, pressure, and speed on each new machine, the factory has a central system that uses a set of blueprints. When a new machine comes online, this system automatically identifies it, consults the blueprints for that machine type, and installs the correct virtual sensors to start collecting data immediately. The CDP Metrics System works on a similar principle: it is an intelligent framework designed to automatically find, calculate, and store performance metrics for any tagged data point in a complex system.
This document will break down the three most important components of the Metrics System — the TagTracker, the MetricDefinition, and the MetricsManager — and show how they work together to achieve powerful, scalable automation.
The Three Pillars of the Metrics System
The system is built on three key components that each have a distinct job. Together, they create a seamless flow from raw data to a calculated result.
| Component | Primary Function |
|---|---|
| TagTracker | Announces what data is available and where. |
| MetricDefinition | Provides a reusable "recipe" for what to calculate. |
| MetricsManager | The "conductor" that uses the recipes to create and manage the calculations. |
Let's explore the role of each component in more detail, starting with how the system discovers data.
TagTracker: The Data Announcer
Every application contains a TagTracker. Its sole purpose is to act as a directory service for the data within its application, making that data discoverable to the rest of the system.
The TagTracker has two key responsibilities:
- Self-Reporting: When a piece of data is "tagged" within an application, the TagTracker automatically reports this tag, providing a Key, Value, and Path triplet. This triplet acts like a unique address, telling the system what the data is (Key and Value) and exactly where to find it (Path).
- Listing Tags: The TagTracker responds to requests from the MetricsManager by providing a complete list of all the tags available within its application. This allows the manager to get a full inventory of all measurable data points.
In short, the TagTracker's job is to make data discoverable for the rest of the system. Once the system knows what data is available, it needs a plan for what to do with it.
MetricDefinition: The Calculation Recipe
A MetricDefinition is a container that holds the instructions for a specific Metric calculation. Think of it as a reusable "recipe" that can be applied to any matching data in the system. For example, you could create one Metric to calculate average speed and apply it to a dozen different motors, all without configuring each one individually.
A MetricDefinition contains one or more Metric blocks along with the CDPTags needed to find the right data to perform the calculation on. Each Metric block not only defines the calculation (e.g., a counter or statistics) but also includes control inputs like Enable, Block, and Reset, allowing for precise control over when the metric is active. This design principle—separating the calculation logic from the data itself—is the key to the system's flexibility.
The MetricDefinition allows a complex metric setup to be defined once, stored in a library, and reused across many different parts of a system without manual configuration for each instance.
But a recipe is just a piece of paper until a chef puts it to use; this is the job of the MetricsManager.
MetricsManager: The System Conductor
The MetricsManager is the central brain or "conductor" of the entire system. It orchestrates the process of matching data with calculation recipes and manages the resulting metrics.
It has four primary responsibilities:
- Finds the Data: It requests tag information from all TagTrackers in the system. This gives it a complete, up-to-date catalog of all available data points across all connected applications.
- Applies the Recipes: It takes the collection of MetricDefinitions and searches its catalog of data points for any with matching tags.
- Creates the Metrics: For every match it finds, it automatically creates a MetricNode (a running instance of the metric calculation). This process is referred to as "auto-creating" or "self-populating" metrics. It's the "magic" that removes the need for manual setup.
- Manages Data and Storage: It directs the flow of data to the newly created metrics and ensures results are saved. It can do this in two powerful ways:
- It manages data flow for real-time calculations using live system values for immediate operational feedback.
- It can use a CDPLogger as a data source to retroactively calculate metrics on historical data, which is invaluable for analysis after an event has occurred.
- Finally, it ensures the final calculated values are counted and stored in a persistent DBValue backend. This not only keeps results safe across system deployments but also tracks the processing state (like a timestamp bookmark) when calculating over historical log data to ensure data integrity.
Now that we understand the individual roles, let's look at why this architecture is so powerful.
Why This Matters: The Power of Decoupling
The genius of the Metrics System lies in its decoupled architecture. By separating the calculation definition (the MetricDefinition "recipe") from the data source (the tags announced by the TagTracker), the system gains massive advantages in scalability, consistency, and maintenance.
Imagine you need to adjust a "total hours" calculation for 200 motors. Instead of manually editing 200 different configurations, you simply update the single MetricDefinition that defines that calculation. The MetricsManager automatically applies this change to every single motor tagged for that metric. This "define once, apply everywhere" model dramatically reduces engineering effort, eliminates configuration errors, and makes maintaining a complex monitoring system incredibly efficient.
With this key benefit in mind, let's see how the components work in sequence.
How It All Works Together: A Step-By-Step Flow
This walkthrough shows the complete data flow, from a tag being added in an application to a final calculated metric being stored.
- Tag Reporting: An application component (like a motor's speed value) is given a tag (e.g., label=speed). The TagTracker within that application automatically reports this new tag, including its Key, Value, and Path.
- Tag Discovery: The MetricsManager requests a list of all available tags from the TagTrackers across all relevant applications. It now knows about the new label=speed tag and where to find its data.
- Matching: The MetricsManager compares the list of available tags against the tags required by its MetricDefinitions. It finds a definition that is configured to look for the label=speed tag.
- Metric Creation: A match is found! The MetricsManager automatically creates a MetricNode in the MetricNodes container based on the recipe in the matching MetricDefinition.
- Data Flow: The newly created MetricNode starts receiving the data it needs to perform its calculation. This can be from real-time CDP values for live monitoring, or by reading historical data from a CDPLogger to perform analysis on past events.
- Storage: The calculated metric value is counted and persisted in the DBValue backend. This ensures the result is saved safely across deployments and that the system can track its calculation progress through historical logs.
Let's make this process more concrete with a real-world example.
A Practical Example: Calculating Motor Speed
Suppose we want to create a simple metric that calculates statistics (like min, max, average) for any value in our system that is tagged with label=speed.
The goal is simple: for any value that has label=speed, calculate a statistics metric. Here is how the components would be configured:
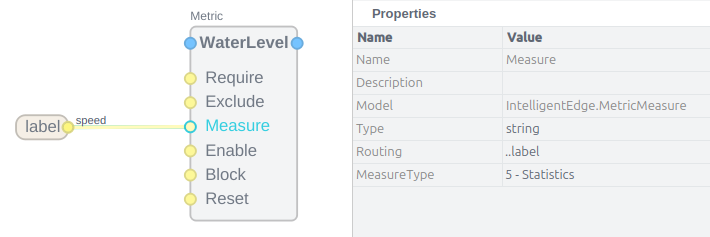
- The Tag: A user would navigate to a specific data point in the control system (e.g., the output value of a motor controller) and add a CDPTag with label as the key and speed as the value. The local TagTracker immediately reports this.
- The MetricDefinition: A MetricDefinition would be created in the system to hold the recipe for this calculation.
- The Metric Block: Inside that definition, a Metric block would be configured. The tag label=speed is routed directly to the Measure input, telling the metric which data to calculate on. The block's MeasureType property would be set to Statistics.
With just these three pieces in place, the MetricsManager would automatically find all values tagged with label=speed—whether there's one motor or a hundred—and create a functioning statistics metric for each one, without any further manual setup.
Conclusion: The Power of Automation
The CDP Metrics System provides a powerful, scalable, and automated way to monitor complex systems. By separating what to calculate (the MetricDefinition) from the where to find the data (the TagTracker) and using a central conductor (the MetricsManager) to connect them, the framework eliminates tedious and error-prone manual configuration. This allows engineers to define a calculation once and have the system intelligently apply it everywhere it's needed, today and in the future.
Get started with CDP Studio today
Let us help you take your great ideas and turn them into the products your customer will love.