MetricsManager
Introduction
The CDP Metrics System is a powerful framework for capturing, calculating, and analyzing operational key performance indicators (KPIs) directly from system data. Its strategic importance lies in its ability to monitor system health, performance, and usage over time, providing engineers and administrators with the tools for data-driven decision-making. By transforming raw operational data into meaningful metrics, the system offers a clear view into the inner workings of complex industrial applications.
At a high level, the system is composed of several core components like MetricsManager that work in concert to discover data points, apply calculation logic, and store the results.
Core Architecture and Data Flow
This section dissects the fundamental architecture of the CDP Metrics system. Understanding the interaction between components and the path data travels from a raw signal to a calculated KPI is crucial for effective configuration and troubleshooting. The system is designed to be flexible, supporting both retroactive calculations on historical data and precise, real-time analysis.
A deeper understanding of how these components interact is essential before proceeding with implementation. The following section details the system's architecture and the path data travels from its source to its final, calculated form.
Core Architecture and Data Flow
This section dissects the fundamental architecture of the CDP Metrics system. Understanding the interaction between components and the path data travels from a raw signal to a calculated KPI is crucial for effective configuration and troubleshooting. The system is designed to be flexible, supporting both retroactive calculations on historical data and precise, real-time analysis.
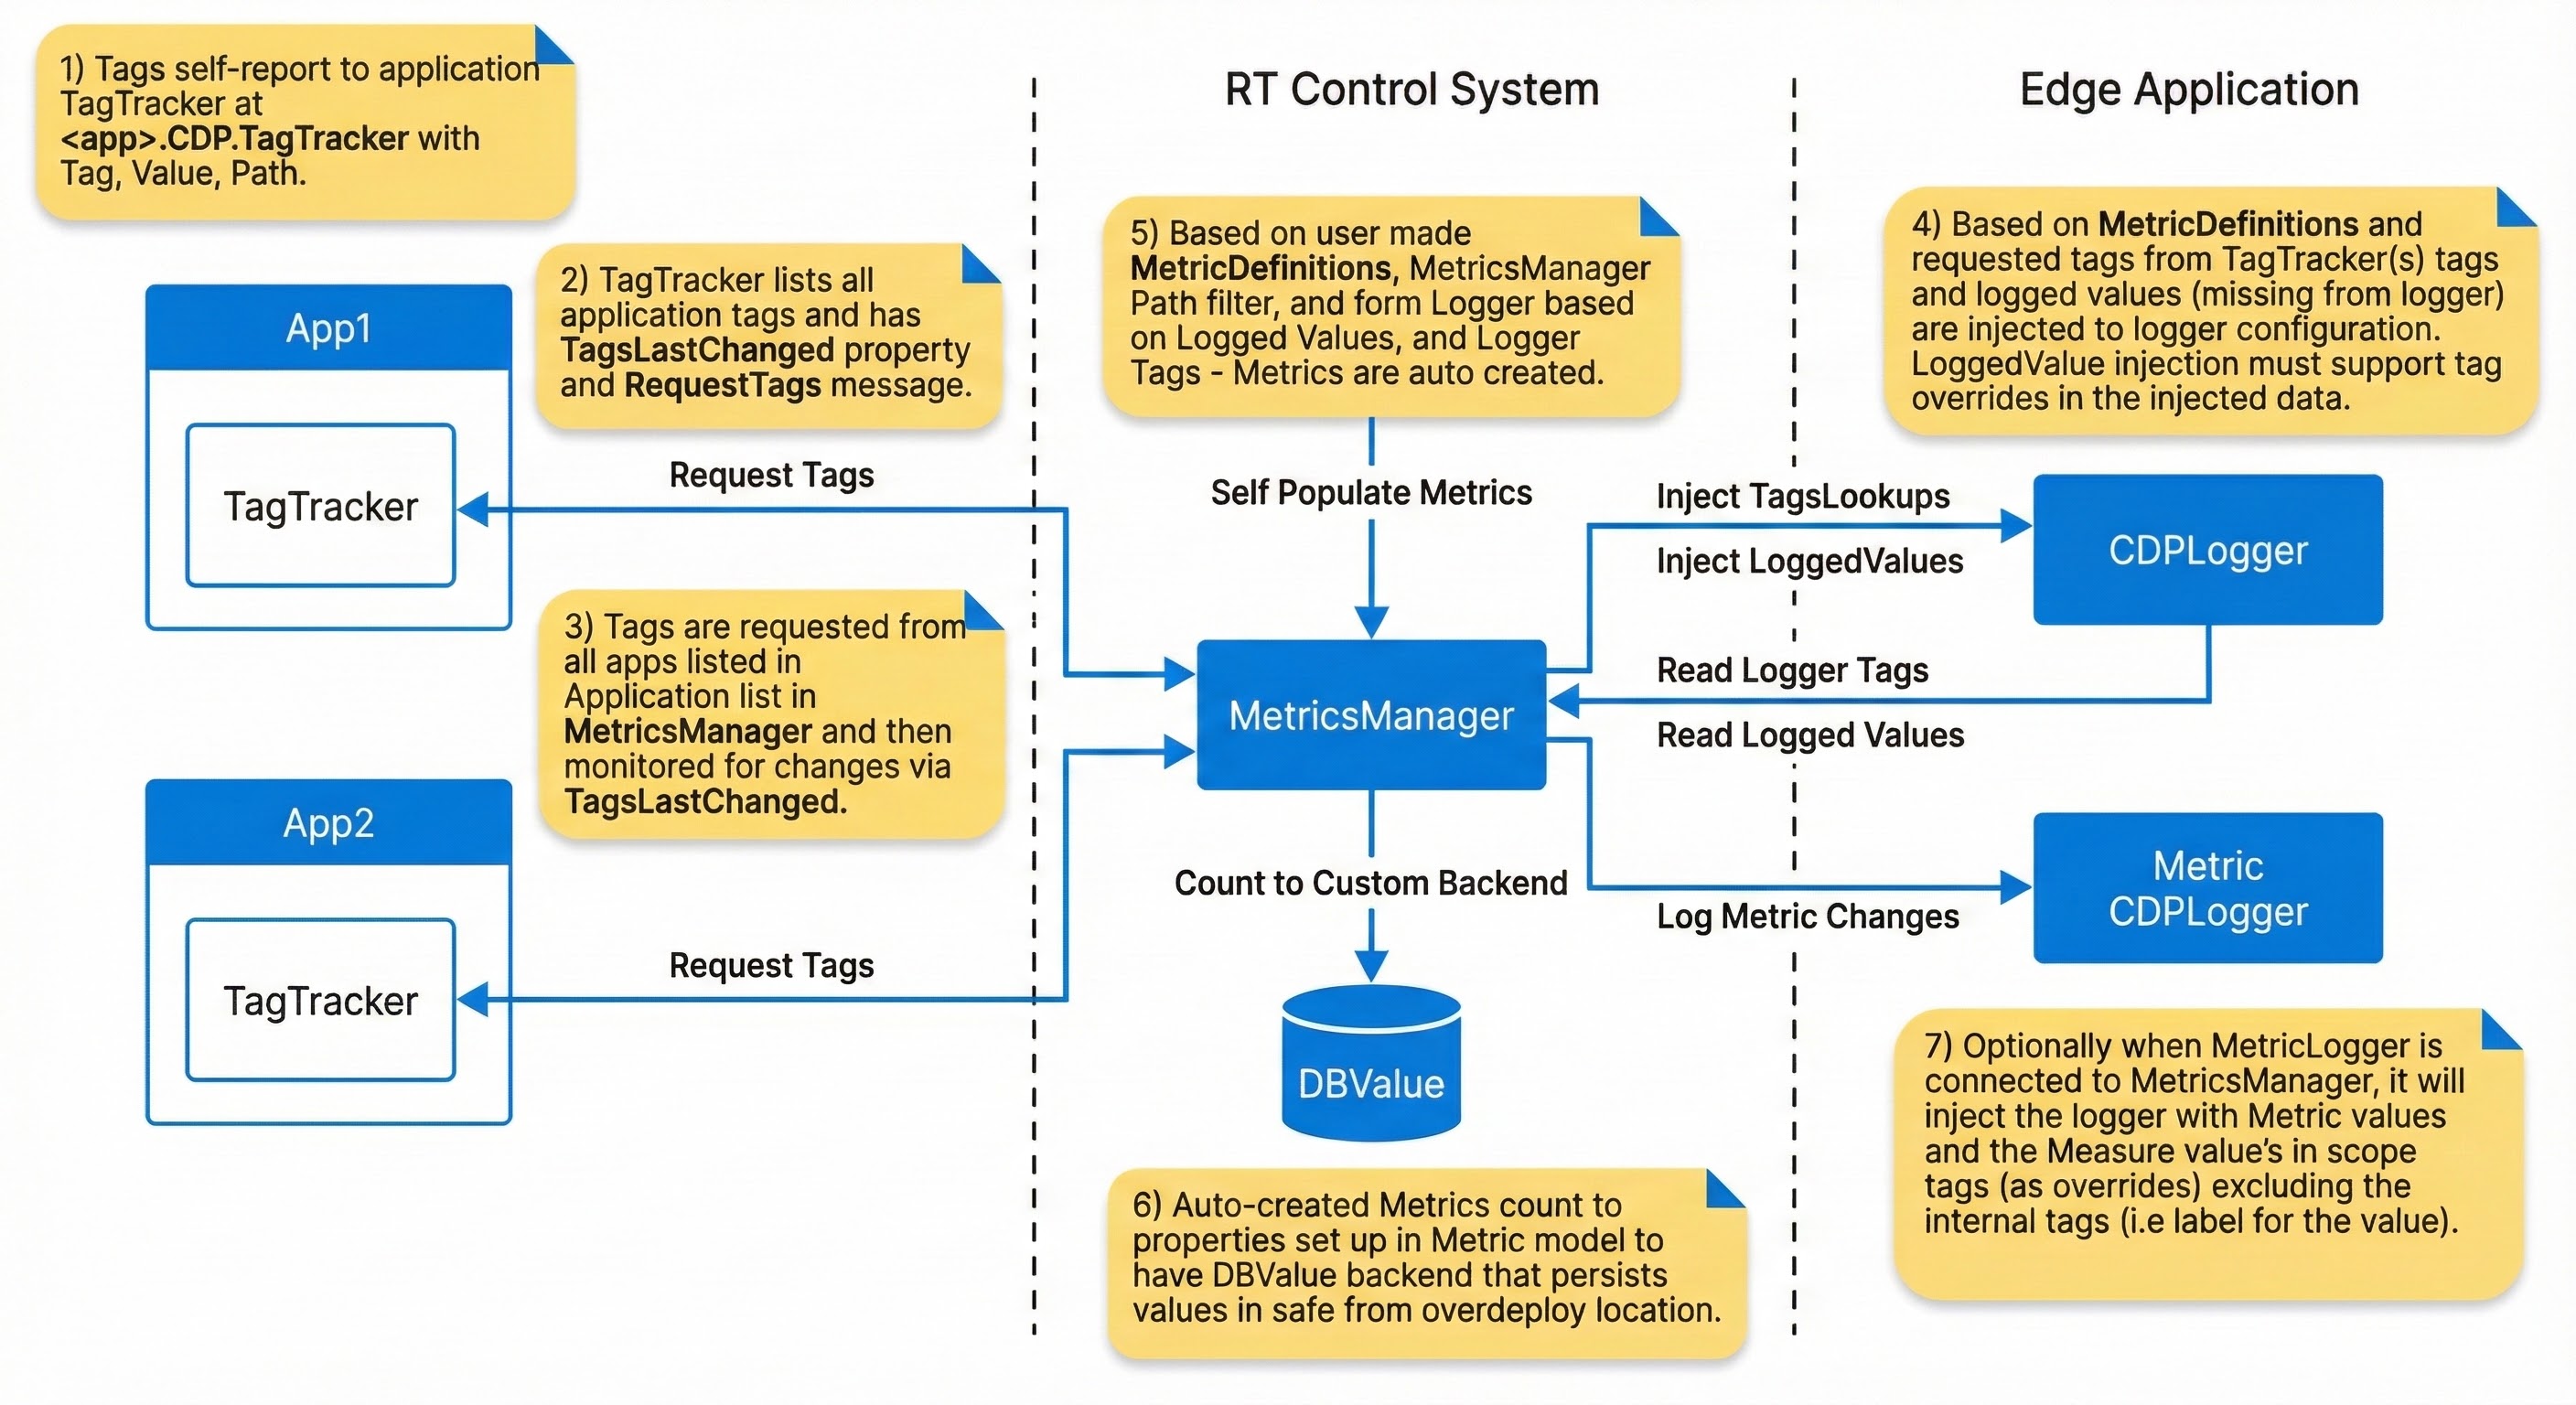
The end-to-end data flow follows these distinct steps:
- Tag Discovery: Within each monitored application, TagTracker components automatically self-report their associated tags. Each report consists of a Key, Value, and Path triplet, which uniquely identifies a data point within the system.
- Tag Aggregation: The MetricsManager requests the lists of tags from all relevant applications in the system. It then monitors these lists for any changes, ensuring that the pool of available data points is always up to date.
- Data Source Integration: The system provides two primary strategies for sourcing the data that will be used in calculations:
- Logger-Based Retroactive Calculation: The MetricsManager can inject tags into the CDPLogger to query historical data. This powerful feature allows for the creation of new metrics that can be calculated retroactively, based on data that has already been logged. However, this approach is subject to limitations in timestamp/data precision if too coarse sampling/delta-sampling is used, as well as any processing latency inherent in the logging pipeline, and data availability.
- Real-time CDP Data: For applications requiring high-precision calculations, the system can use a lightweight listener to access data directly from the real-time CDP backend. This method bypasses the logging pipeline entirely, using exact arrival from backend timestamp information to deliver the most accurate metric calculations possible. Note that set fs rate on MetricsManager's parent component will effectivly sample all incoming data.
- Metric Instantiation: The MetricsManager uses the recipes defined in MetricDefinition blocks to find matching tags across the system. For every matching tag that is discovered, it automatically creates a MetricNode instance—a dedicated calculator that will perform the specified logic on that specific data point.
- Value Persistence and Logging: The auto-created MetricNode instances persist their state and calculated values to a DBValue backend. This protects the integrity of long-running counters from events like system over-deployment. The final calculated values are then routed to a custom backend or, optionally, to a dedicated Metric CDPLogger for storage and further analysis.
Choosing A Data Source Strategy (Logger vs Real-time)
Selecting the data source is a foundational KPI design choice. It determines timestamp fidelity, metric data latency and whether you can calculate metrics retroactively. Use the guidance below to align the data source with the accuracy requirements of each KPI.
| Requirement | Recommended data source | Why it matters |
|---|---|---|
| Backfill or retroactive analysis is required. | Logger-based (CDPLogger.LoggerDataSource) | Uses historical logs, but timestamps can be skewed by too sparse sampling or other logger sampling features like delta sampling etc. Note also that log data may be missing if the logger was not running at the time or needed data was not logged before metric creation. Also note that logs may be limited in retention time. |
| High-frequency, order-sensitive or near-real-time metric monitoring is needed. | Real-time (MessengerMetricDataSource / RDRealtimeMetricDataSource) | Uses exact data arrival timestamps and avoids logging sampling or potential timesync jitter problems. |
Concrete examples:
- Delta Counter or fast Basic Counter: choose real-time. Even small logger or delta sampling changes to the measured deltas and can introduce errors.
- Hour Counter or long-window statistics: logger-based is usually acceptable. Small timestamp errors are negligible over hours or days, and retroactive analysis is often more valuable.
Mixing data sources inside a single MetricsManager is not possible, first data source is used. If you need both precise real-time behavior and retroactive analysis, define separate MetricsManager instances) so each KPI uses a single, intentional data source.
The Role Of CDPTags
CDPTags are the fundamental mechanism for linking abstract metric definitions to live data points within the control system. They act as a semantic layer, allowing metrics to be defined based on what a data point is (e.g., a "speed" measurement) rather than where it is physically located in the application tree. This approach enables the creation of highly reusable and scalable metric configurations.
A CDPTag can be interpreted using a semantic structure similar to the Resource Description Framework (RDF), composed of a Subject, Predicate, and Object.
| Semantic Role | CDP Mapping | Example |
|---|---|---|
| Subject | Tag location (path) → and re-tagged path | Crane.IO.Aux.Winch.Drive → /deck/crane/drive |
| Predicate | CDPTag.name | function |
| Object | CDPTag.value | hoisting |
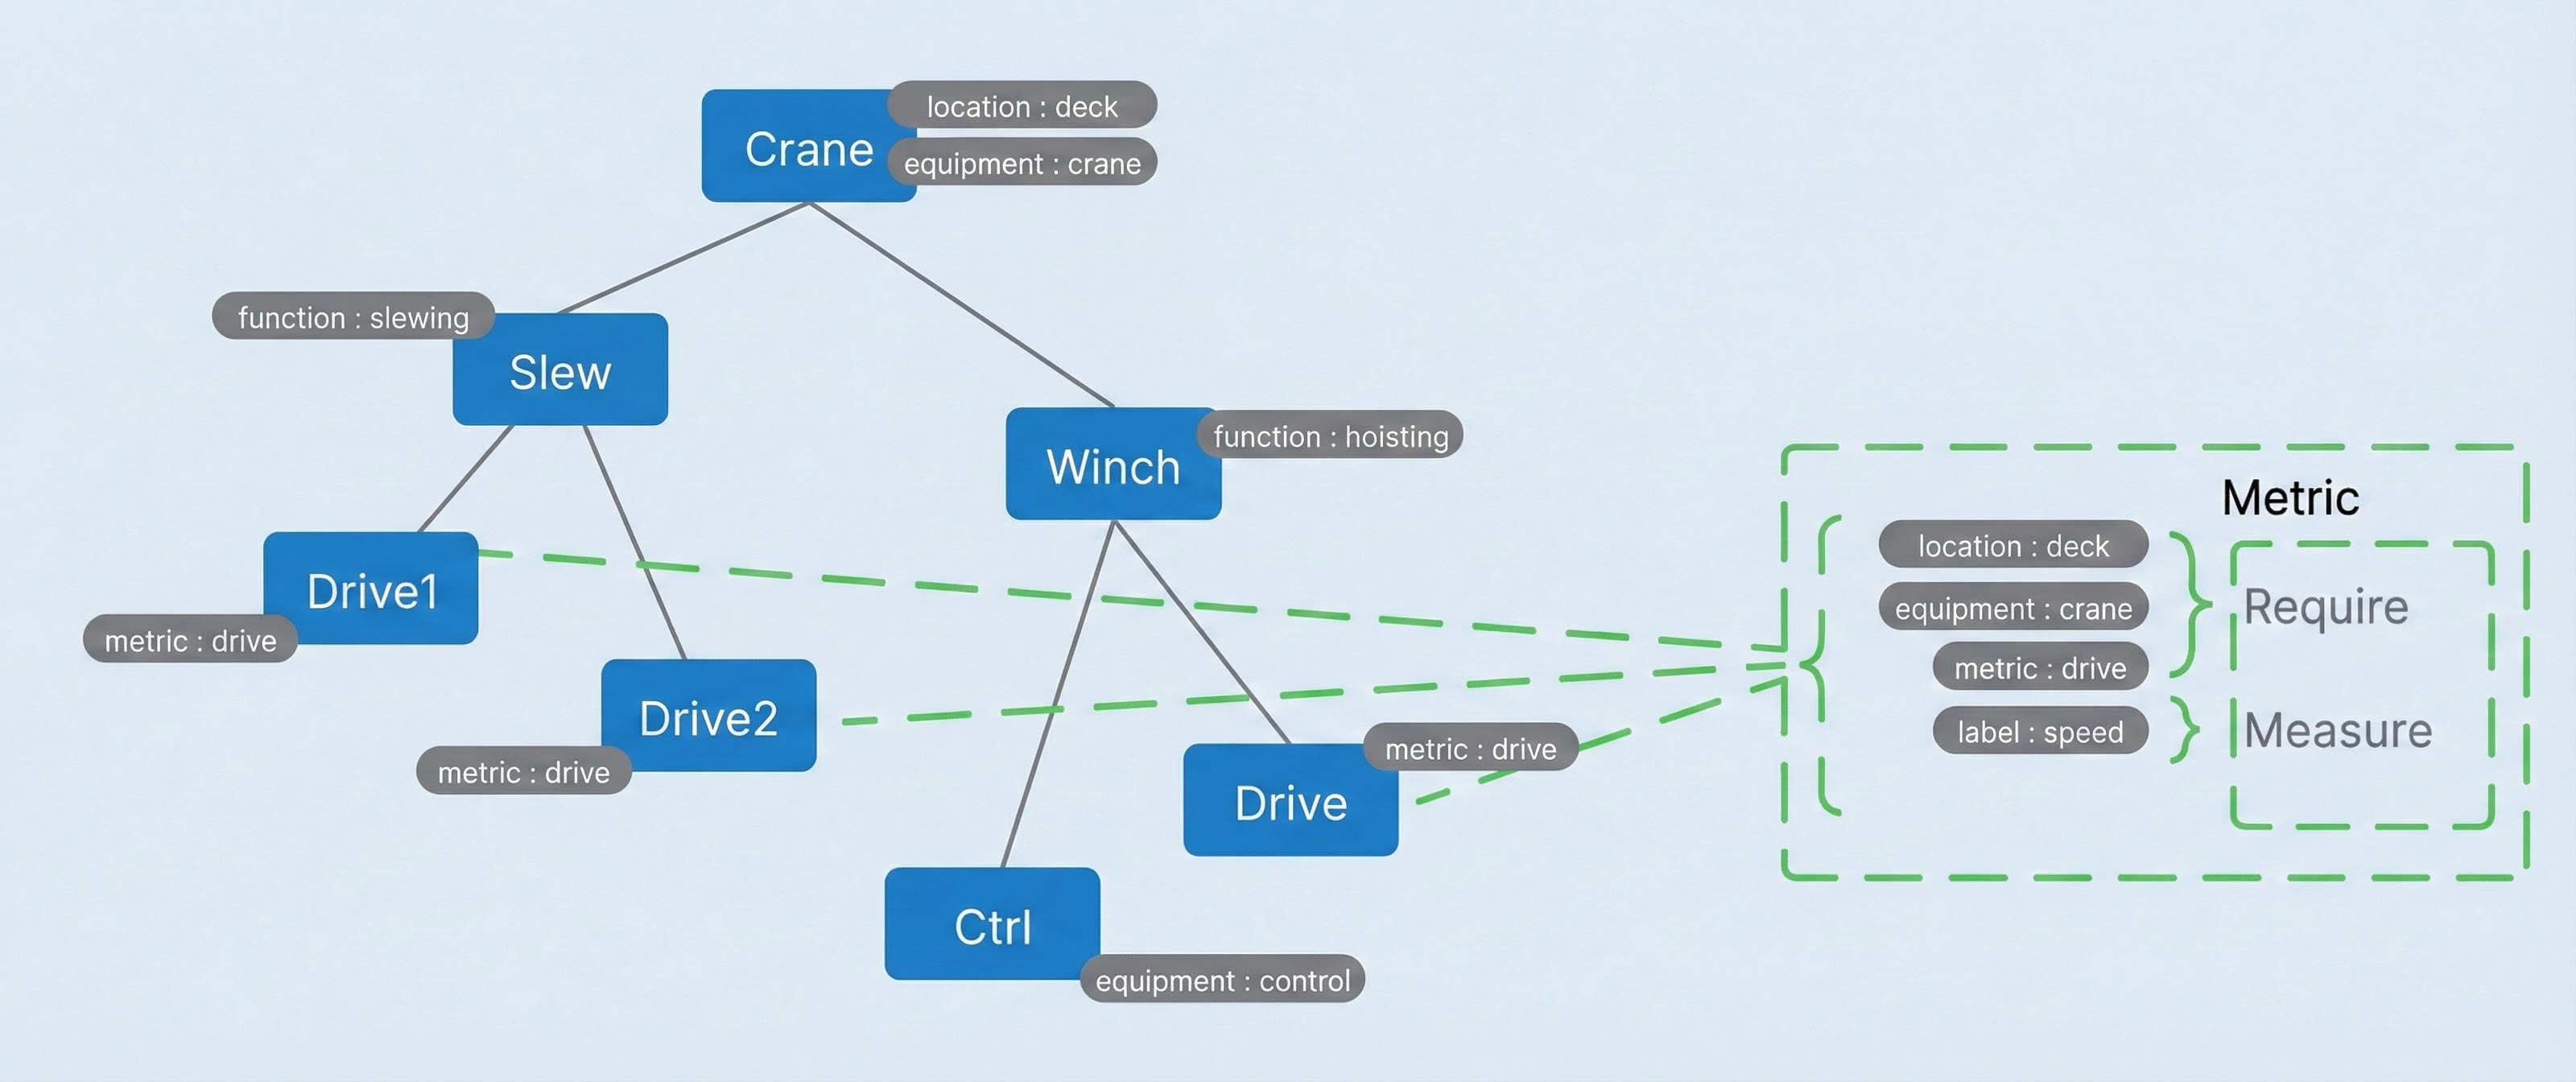
This structure, particularly the ability to create a universal re-tagged path, allows the system to intelligently map metric logic to the correct components automatically using a powerful abstraction mechanism. With a clear understanding of the architecture, we can now examine the specific components that system administrators will configure.
Configuration Deep Dive
System developers will primarily interact with three key components to build and manage KPIs: the MetricsManager, the MetricDefinition, and the Metric block. The following subsections detail the specific properties and configuration options for each, providing the foundation for building custom metrics.
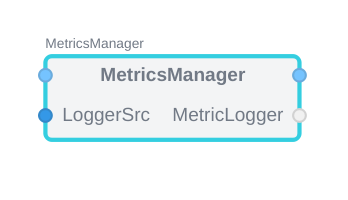
MetricsManager
The MetricsManager is the primary engine of the metrics system. Its responsibilities include locating all TagTrackers across designated applications, instantiating MetricNode calculators for every MetricDefinition match, and managing the flow of data to and from the logging backend. The behavior of the MetricsManager can be controlled through several key properties and objects.
- AddValuesToLogger (bool, default true): when enabled, sends CM_ADD_LOGGED_VALUES for each new MetricNode so a connected logger creates matching LoggedValue entries.
- DataSource: sample source. Accepts
CDPLogger.LoggerDataSource,MessengerMetricDataSource, orRedundancy.RDRealtimeMetricDataSourceand is attached to all MetricNodes. - DataSink (optional child): calculated sample destination. Accepts
CDPLogger.LoggerDataSink. - MetricNodes (runtime): root folder that will contain the generated MetricNodes hierarchy.
MetricsManager With Redundant Applications
Redundant applications should produce one consistent set of KPIs even when the leader changes. The goal is to keep metric definitions stable, avoid duplicate tag discovery, and ensure metrics always reflect the active leader without reconfiguration during switchover.
The recommended approach is:
- Point SourceAppList to the single application instance you want to use for tag discovery (typically the primary configuration copy).
- Use
Redundancy.RDRealtimeMetricDataSourceas the MetricsManager data source to make real-time values follow the current leader. - Keep RDAppList aligned with the group defined for
Redundancy.RDSelector. - Route the data source to the
RDSelector.LeaderIndexso leader changes are reflected in KPI values immediately.
MetricsManager:
  SourceAppList: RDApp1
  DataSource:
    Model: Redundancy.RDRealtimeMetricDataSource
    RDAppList: RDApp1;RDApp2;RDApp3
    Routing: RDSelector.LeaderIndex
With this setup, tag discovery stays stable and KPI values follow the currently elected leader across the redundant group.
MetricDefinition
The MetricDefinition block serves as a reusable container, or "recipe," for a complete metric setup. It is designed to hold one or more Metric blocks and the associated CDPTags that define their input data. By encapsulating a full KPI configuration within a single MetricDefinition, administrators can create modular, organized, and easily shareable metric libraries, which is especially valuable in complex systems with many similar components.
- PathFormat (required): semicolon-separated tag short names used to build folder segments. Uses the nearest non-empty value across all Measure paths; empty values are skipped.
- CollisionPathFormat (optional): alternate tag list used only when PathFormat would produce no segments.
- CountedTags (required): tag names allowed to repeat at a level; each occurrence gets a numeric suffix (see CountFormat).
- CountFormat (required, default "%d"): printf-style format for the suffix applied to CountedTags.
PathFormat Output Examples
PathFormat builds a predictable folder hierarchy under MetricNodes by mapping tag values to path segments (semicolon order becomes the folder order).
Example 1 - direct mapping:
| Tag name | Tag value |
|---|---|
| location | deck |
| equipment | crane |
| metric | drive |
PathFormat: location;equipment;metric
Output: MetricNodes.deck.crane.drive
Example 2 - collision-safe with CountedTags:
PathFormat: location;equipment;motor;metric
CountedTags: motor
CountFormat: "_%02d"
Output (two motors with motor=drive, metric=torque, and location/equipment as above):
  MetricNodes.deck.crane.drive_01.torque
  MetricNodes.deck.crane.drive_02.torque
If PathFormat resolves to no segments (tags missing or empty), the system tries CollisionPathFormat; if that is also empty, the MetricNode is placed directly under MetricNodes.
Metric
The Metric block is the core configuration unit where the specific logic for a single KPI is defined. It contains a set of inputs that allow for precise control over when a metric is calculated and what data it uses.
The primary input controls on the Metric block are:
- Require: Specifies one or more CDPTags that must be present in the scope of a potential data point for a metric instance to be created. This acts as a primary filter. If the connected definition tag has an empty value, Require checks only for presence: the first matching tag found while searching from the measure path toward the root satisfies the requirement regardless of that found tag's value. If the connected definition tag has a non-empty value, the nearest matching tag must also have the same value; a nearer tag with the same name but a different value shadows outer matches.
- Exclude: Specifies CDPTags that must not be present. If a tag connected to Exclude is found, a metric instance will not be created for that data point. If the connected definition tag has an empty value, any matching tag found while searching from the measure path toward the root excludes the metric regardless of that found tag's value. If the connected definition tag has a non-empty value, exclusion happens only when the nearest matching tag has the same value; a nearer tag with the same name but a different value shadows outer matches.
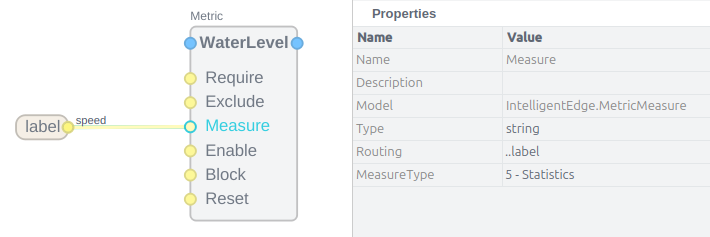
- Measure: Connects the CDPTag identifying the primary data point whose value will be measured and processed by the metric's Measure channel calculation logic.
- Enable: A conditional input. The metric will only perform its calculation when a signal tagged and connected to this input is active (e.g., true or non-zero).
- Block: An override input that stops the metric calculation regardless of the Enable state. If a signal connected to Block is active, the calculation is paused.
- Reset: A trigger input that resets the metric's internal state to its initial value (e.g., setting a counter back to zero).
The Metric block also exposes naming properties for emitted tags:
- MeasureTag: names the auto-generated tag attached to calculated metric property samples.
- GroupPathTag: names the virtual tag created on each MetricNode for its resolved GroupParent path. Default is
uri.
Control Truth Conversion (Threshold and Hysteresis)
Measure, Enable, Block, and Reset inputs are coerced into boolean truth values before edge detection and gating. The rules are:
| Input type | Coerced truth rule |
|---|---|
| Boolean | Uses the value directly; Threshold and Hysteresis are ignored. |
| Numeric | true when value > (Threshold + Hysteresis), false when value < (Threshold - Hysteresis), otherwise keep the previous state. |
| String | "true/1/yes/on" => true, "false/0/no/off" => false; otherwise parse as a number and apply the numeric rule. If parsing fails, keep the previous state. |
| Undefined or NaN/Inf | Treated as false; no edges are generated. |
Default Threshold is 0.5 when not set or invalid. Built-in math engines use a very small hysteresis band derived from Threshold (H = 1e-9 * max(1, abs(T))) to prevent chatter at the boundary. Reset triggers on a rising edge of the coerced truth value.
Example (Threshold = 100, Hysteresis = 0.5, previous state = false):
| Value sample | Coerced state |
|---|---|
| 99.7 | false |
| 100.2 | false (inside deadband) |
| 100.6 | true (rising edge) |
| 100.1 | true (holds previous) |
| 99.4 | false (falling edge) |
If you use analog inputs, set Threshold explicitly; otherwise the default 0.5 will likely be incorrect.
Metric Calculation Types
The Measure input on the Metric block has a MeasureType property that defines the mathematical operation to be performed. The following calculation types are available:
- None: Applies no math to the input Measure value(s) and passes no value directly to the metric log, but allows the Measure value(s) to be processed directly.
- Pass Trough: Passes the measured value directly to metric storage. This is used to splice interesting windows out from regular timeseries data to only store when the data is interesting, based on the Enable and Block controls.
- Basic Counter: Increments a counter on rising edges over Threshold while enabled or on the rising edge of a boolean signal connected to the Measure input.
- Hour Counter: Accumulates time in hours while enabled and Measure is true over Threshold.
- Delta Counter: Accumulates absolute deltas while enabled between samples that exceed Threshold.
- Statistics: Calculates a suite of statistical values while enabled for the measured signal, including minimum, maximum, average, and standard deviation.
- Custom: uses a CustomMetricMath child under MetricMath.
Custom Metric Math (Why And When)
Use Custom Metric Math when a KPI needs a domain model or multi-signal logic that the built-in MeasureTypes cannot express. Typical cases are life or health estimates based on temperature, torque, or speed history, or when you need extra outputs (for example, damage, remaining life, or custom rates).
What it involves at a high level: create a CustomMetricMath-derived model that implements the math callbacks and exposes parameters/outputs as properties, then attach it under MetricMath and set MeasureType to Custom. MetricsManager stores the configured math as a prototype and instantiates it per MetricNode so each instance keeps its own state.
For details and examples, see Advanced: Custom Metric Math.
The Metric block also includes an optional Histogram feature. When enabled, it captures the distribution of the measured value over time by sorting values into configurable bins, providing insight into how much time a signal spends within specific operational ranges.
MetricNode Placement And Naming
Runtime MetricNodes are created under the manager's MetricNodes folder. Their placement and final leaf name are controlled by two layers:
- MetricDefinition decides the folder structure.
- Metric decides the MetricNode leaf name inside that folder path.
The MetricDefinition properties PathFormat, CollisionPathFormat, CountedTags and CountFormat define how the parent folder hierarchy is built. In practice this means the resolved tag values from PathFormat create the nested MetricNodes folders first, and only then is the runtime MetricNode leaf created under the resolved folder.
Example:
PathFormat: location;equipment;label
CountedTags:
Output folder: MetricNodes.deck.crane.speed
The Metric block then controls how the runtime MetricNode leaf name is generated inside that folder.
By default, NodeNameFlags is 0. In that mode the system has default auto-naming behavior based on the following rules:
- If Measure routing resolves to one or more tag values for the group, the base name is built from those values joined with underscores.
- Otherwise the base name falls back to
MetricName_SourceShortName, whereSourceShortNameis the last path segment of the representative Measure path. - A numeric suffix is then appended using
MetricDefinition.CountFormat.
When NodeNameFlags is non-zero, the MetricNode name is composed from the selected parts in fixed order:
N: Metric node name, meaning the short name of the Metric block.S: Source Measure value short name, meaning the last path segment of the representative Measure path for the group.R: First Require tag value resolved for the group.M: First Measure tag value resolved for the group.C: Count number rendered usingMetricDefinition.CountFormat.
If C is not set, the base name is used without a count suffix. A numeric suffix may still be added when needed to avoid a sibling name collision.
Combined example:
MetricDefinition:
  PathFormat: location;equipment;label
  CountFormat: "%d"

Metric:
  Name: Energy
  NodeNameFlags: NSMC

Resolved folder: MetricNodes.deck.crane.power
Measure path: deck.crane.Motor1.Power
First Measure tag value: power
Output leaf: Energy_Power_power1
Full path: MetricNodes.deck.crane.power.Energy_Power_power1
MetricNode
The MetricsManager uses the recipes defined in MetricDefinition blocks to find matching tags across the system. For every matching tag that is discovered, it automatically creates a MetricNode (runtime and read-only) instance — a dedicated calculator that will perform the specified logic on that specific data point.
The MetricNode can have the following properties available depending its source Metric setup:
- GroupParent: resolved parent path(s) shared by the routed measure group.
- MeasurePaths lists the bound value paths.
- EnablePaths / BlockPaths / ResetPaths: resolved control paths;
- MeasureType shows the numeric code above.
- Histogram, BinSize, BinCount, BinOffset plus StartBound / EndBound / Threshold: effective math options.
- MeasureTag: tag name used when publishing calculated values.
- GroupPathTag: tag name used for the virtual tag carrying the resolved GroupParent path.
- LastProcessedTimestamp: watermark for how far historical data has been processed.
- Count, LastValue, LastState, Hysteresis: Basic Counter state.
- Hours, LastTime, LastActive: Hour Counter state.
- SumDelta, LastValueValid: Delta Counter state.
- Min, Max, Mean, Std, M2, Samples: Statistics state.
- AggregateActive: Aggregate OR/AND result.
- Histogram element: per-bin values when histogram is enabled.
- Tags: virtual tags propagated to sinks (Measure, Require, and GroupParent path tags).
With this understanding of the individual components, you are now ready to apply this knowledge in a practical, step-by-step configuration process.
Step-By-Step Configuration Guide
This section provides a practical walkthrough for configuring a new metric from start to finish. It uses concrete examples based on the components detailed in the previous section to illustrate how to build both simple and complex KPIs.
Step 1: Configuring A Basic Counter
This guide will create a simple metric that counts every occurrence of an event associated with a specific tag. The goal is to create a metric for any value that has the tag label=tanklevel.
- Add a MetricDefinition block to the MetricsManager component in your application. This will serve as the container for the new metric.
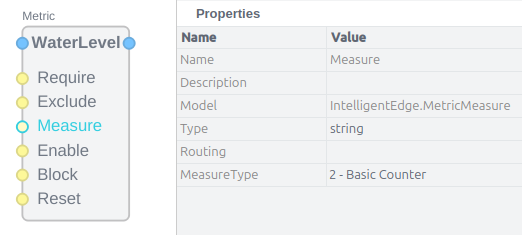
- Inside the MetricDefinition, add a Metric block. This block will contain the calculation logic. For clarity, it could be named something like
WaterLevel. - Select the Measure input on the Metric block. In its properties, set the MeasureType to
2- Basic Counter. This configures the block to increment a counter. - Add a CDPTag to the MetricDefinition. Configure this tag with
labelas the name andspeedas the value. - Connect the output of the CDPTag (
label=tanklevel) to the Measure input of the Metric block. - Set the
Thresholdon Metric block to 100
With this configuration, the MetricsManager will now scan the system for any signals tagged with label=tanklevel and will automatically create a counter instance measuring how many times the tanklevel value rises above Threshold for each one it finds.
Step 2: Implementing A Conditional Metric
Building on the previous example, you can create a more complex metric with specific conditions for when it should be active. The goal is to calculate a metric for any value that has label=tanklevel and also requires metric=feedtank, but only when the closest in scope value with control=enabled is set and neither control=service nor control=fault are active.
- Begin with a Metric block, similar to the previous example.
- Add a CDPTag for
metric=feedtankand connect it to the Require input. This ensures the metric only applies to signals that are explicitly identified as feedtank metrics. - Connect the CDPTag for
label=tanklevelto the Measure input. This remains the value being counted or measured. - Set the
Thresholdon Metric block to 100 - Add a CDPTag for
control=enabledand connect it to the Enable input. The metric will now only be active when the closest in scope value with this tag is set. - Add two more CDPTags:
control1=serviceandcontrol2=fault. Connect both of these to the Block input. This will prevent the metric from counting if the feedtank is in a service mode or has a fault.
Note: Trailing digits in tag names are reserved for MetricDefinition disambiguation. The MetricsManager strips numeric suffixes from routed tag names before matching, so control1 and control2 are both treated as control. This allows you to declare multiple tags with the same logical name but different values while keeping CDP node names unique. Avoid ending system tag names with digits; use a different name or a separator such as control_a or control_1 if you need a numeric label.
This combination of Require, Enable, and Block inputs creates a highly precise condition. A metric instance will only be created for a feedtank's tanklevel signal, and it will only count when the feedtank is explicitly enabled and not in a service or fault state.
Step 3: Configuring A Statistics Metric
This example demonstrates how to configure a metric to calculate a full suite of statistics for a given signal.
- Add a Metric block and a CDPTag for the signal you wish to analyze (e.g.,
label=speed). - Connect the CDPTag to the Measure input of the Metric block.
- In the properties of the Measure input, set the MeasureType to
5- Statistics. - With this setting, the MetricNode instantiated for this signal will automatically calculate and update values for Minimum, Maximum, and Standard Deviation whenever the metric is enabled.
- To finely control when these statistical values are logged, you can use the LogOn control option flags. For example, setting the flag to
Ewould log the latest statistical values only on the rising edge of the Enable signal. The available flags are:S: Log on each sample.E: Log on rising Enable edge.e: Log on falling Enable edge.B: Log on rising Block edge.b: Log on falling Block edge.R: Log the last value before a Reset.
By mastering these configuration patterns, you can move from setting up individual metrics to building a comprehensive library of common industrial KPIs.
Example KPI Recipes For Industrial Applications
This section provides practical, reusable recipes for common KPIs found in industrial systems. The source documentation outlines dozens of potential crane and motor metrics—from the "Number of redundancy switch overs" to the "Number of lifts where 90% alarm was triggered." The following recipes demonstrate fundamental patterns that can be adapted to implement this extensive library of KPIs, serving as templates for building out a full monitoring solution.
Recipe: Accumulated Counter
An accumulated counter tracks the total number of events since a system was commissioned.
KPI Example: "Number of landings accumulated since handover"
Implementation:
- Configure a Metric block with its MeasureType set to Basic Counter.
- Identify the system signal that indicates a successful landing (e.g., a boolean signal that pulses true for one cycle upon completion).
- Apply a CDPTag to this signal, such as
event=landing_complete. - Connect this tag to the Measure input of the Metric block.
- The metric will now persist its count in the DBValue backend, providing a continuous, cumulative total of all landings.
Recipe: Resettable Counter
A resettable counter tracks events over a specific period, such as a day, week, or operational session.
KPI Example: "Number of alarms in the last week"
Implementation:
- Configure a Metric block with its MeasureType set to Basic Counter.
- Identify the signal that represents an alarm event (e.g., a boolean that goes true when any alarm is active) and tag it (e.g.,
event=alarm). Connect this tag to the Measure input. - Create a timer signal in your control application that generates a pulse once per week. Tag this signal (e.g.,
control=weekly_reset). - Connect the weekly reset tag to the Reset input of the Metric block.
- The metric will now count all alarms, and its value will be reset to zero at the start of each week, enabling weekly reporting.
Recipe: Histogram For Operational Analysis
A histogram is used to understand the distribution of a signal's value over time, revealing how much time a component spends in various operational states.
KPI Example: "Torque buckets (10%) filled with time" for a motor.
Implementation:
- Configure a Metric block and enable its Histogram property.
- Set the histogram properties to create the desired buckets. For 10% buckets of a motor with a maximum torque of 500 Nm, set
HistogramBinSizeto 50 andHistogramBinCountto 10. - Tag the motor's real-time torque output signal (e.g.,
label=torque,metric=motor). - Connect this tag to the Measure input of the Metric block. The metric now functions as a distributed hour meter; the values accumulated in each bin represent the time in hours that the motor's torque was within that bin's range.
- The resulting histogram will show how many hours the motor has operated within each 10% torque bracket. This analysis is critical for monitoring load cycles for fatigue and other forms of advanced performance and wear analysis.
By combining the core components and applying these practical recipes, administrators and engineers can build a comprehensive and customized monitoring system that is perfectly tailored to their specific operational needs and analytical goals.
Tips
- Tag lookup follows CDPTag overshadow rules: the closest tag with the right name/value wins; deeper tags hide ancestors.
- When MeasureType is Custom, ensure a MetricMath child exists.
- If PathFormat tags resolve to empty strings, the MetricNode is placed directly under the MetricNodes folder.
Get started with CDP Studio today
Let us help you take your great ideas and turn them into the products your customer will love.