Creating a Database Graph GUI
Introduction
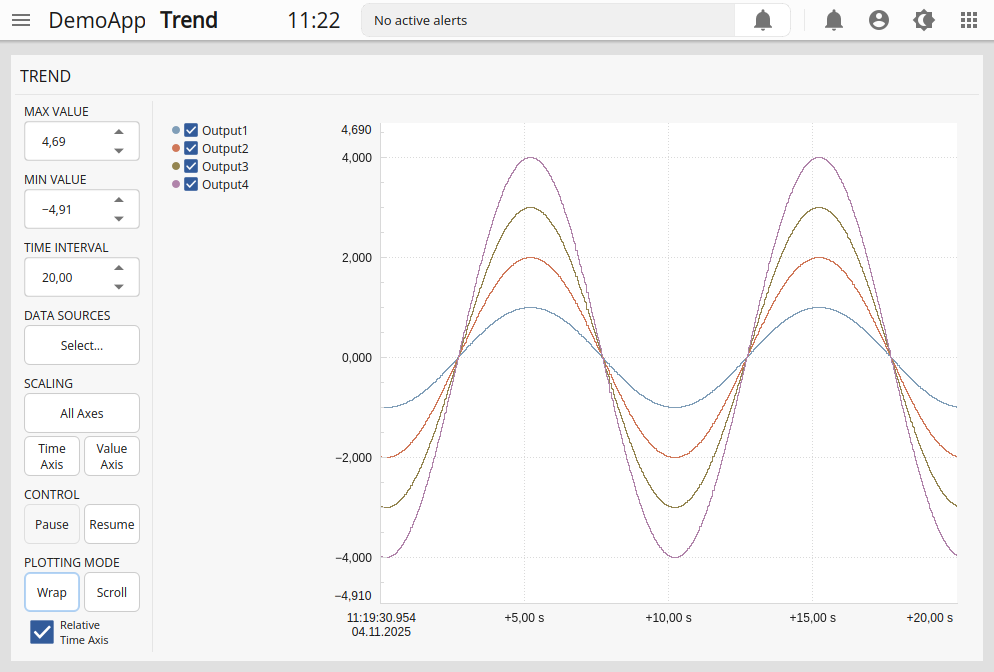
This example demonstrates how to visualize logged signal data in a GUI using the Database Graph widget.
The application includes a CDPLogger that continuously records the output from four sine wave components. Logged data is stored in a database and visualized in real time using the database graph.
In addition to showing how logged signals can be displayed and analyzed, the example illustrates how external control widgets can be connected to the graph through the widget signal-and-slot mechanism, creating an interactive and configurable user interface.
Logger Configuration
The only configuration required for the logger is to specify the values to be recorded, listed under the LoggedValues section of the CDPLogger configuration. Each entry name defined in this configuration is used as the signal name displayed in the graph legend.
See the example How to Setup Logging in Automation System for a demonstration of how to configure and use the CDP Logger.
GUI Overview
Although the database graph can operate as a stand-alone element, several control widgets have been added to demonstrate dynamic configuration using widget connections.
These widgets allow the user to:
- Adjust minimum and maximum values on the y-axis.
- Configure the x-axis interval in seconds.
- Select data sources to display.
- Perform auto-scaling of the axes using buttons for Y, X, or both axes.
- Pause and resume graph plotting to allow analysis of the logged data.
- Change the plotting mode between scrolling (trending) and wrapping modes.
- Enable relative x-axis mode for oscilloscope-like analysis, available for the wrapping mode.
Both the button for selecting data sources (DB Graph Configuration) and the Database Graph have their cdpLoggerRouting property configured with the path of the local logger component.
In CDP Studio Design mode, toggling between normal configuration and connection mode is done pressing F4 and F3 on the keyboard.
How to Run the Example
To run the example from CDP Studio, open Welcome mode and find it under Examples. Next, in Configure mode right-click on the system project and select Run & Connect. See the Running the Example Project tutorial for more information..
Get started with CDP Studio today
Let us help you take your great ideas and turn them into the products your customer will love.