How to Analyze a System
A very useful feature of CDP Studio is the possibility to inspect all the values of the running system, in real-time. Even more, you can visualize the values and plot them as a graph. This is very useful when testing, analyzing, tuning and searching for possible issues in a system.
Another very useful feature is that you can override the live system and alter values for testing or tuning the system. The values can be changed in the Block Diagram side panel, the Watch list or in the Table Editor.
Inspect the Running System
Once the system is running and connected, you can observe all values in real time in Configure mode.
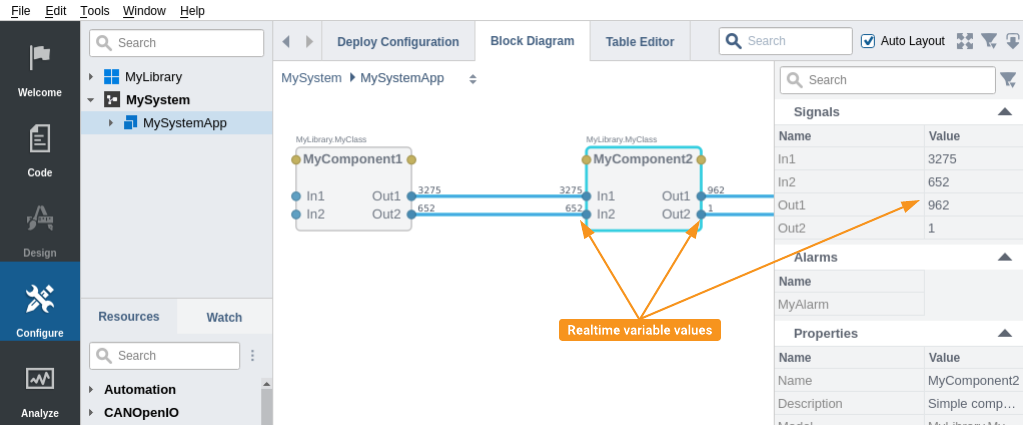
In the Block Diagram the real-time values are shown next to the input variable of the component as well as in the side panel. The MyComponent2 is selected and seen in the side panel in the example below. The same information is also available in the Table Editor. The live values will be shown for the component that you select in the Project tree.
Alarms and Events
The CDP Studio has two special output panes for alarms and events:
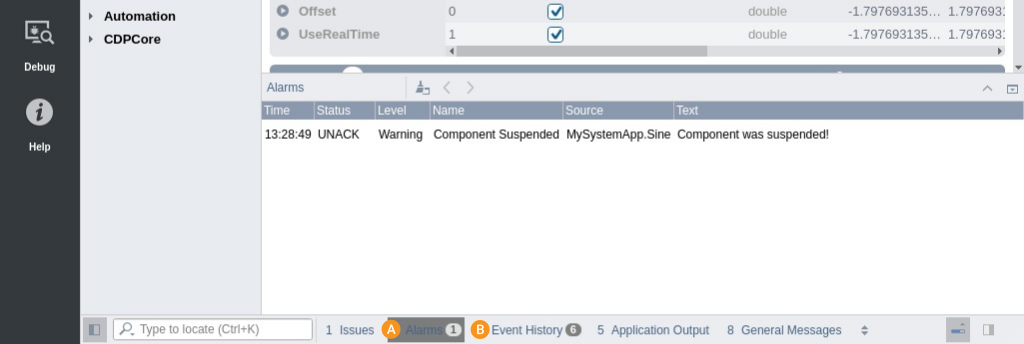
- The Alarms pane shows all active alarms in the system and allows acknowledging them by double-clicking on the alarm. Alarms typically indicate problems in the application, such as no contact with an I/O device, a low value of a process variable or similar.
- The Event History pane shows the history of events that have occurred in the running application. This includes application boot and alarm events (emitted when an alarm is set, cleared or acknowledged).
In addition to the special output panes, events can be visualized in plots alongside plotted values. For more information, see the Analyze Mode Manual.
Analyze the System
CDP Studio Analyze mode lets you visualize the signals and other values in your system.
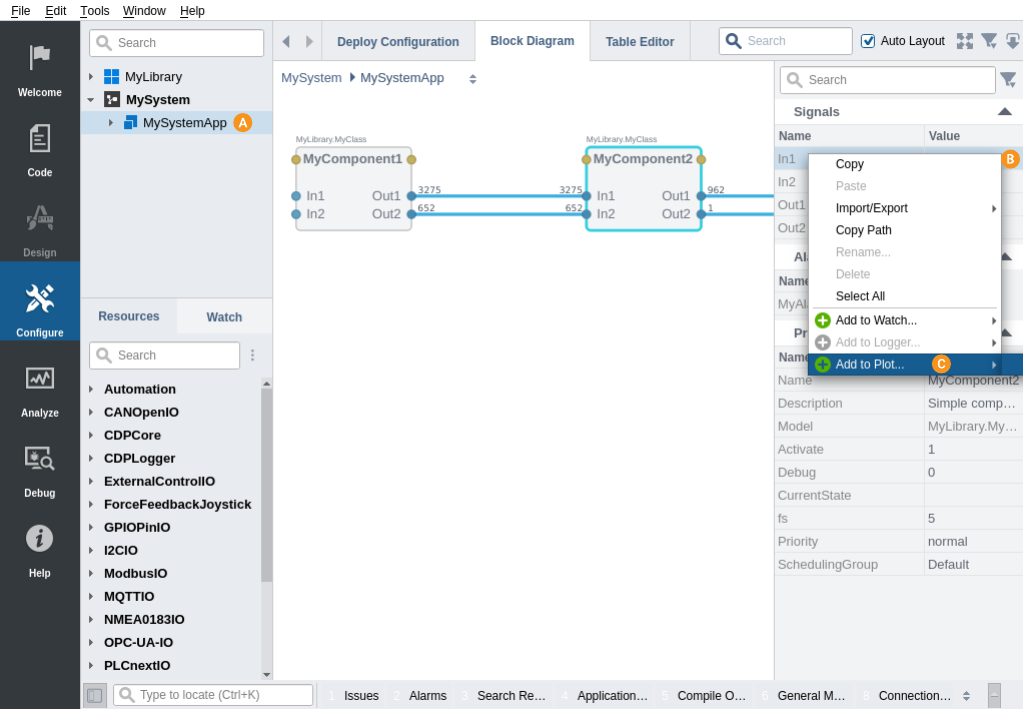
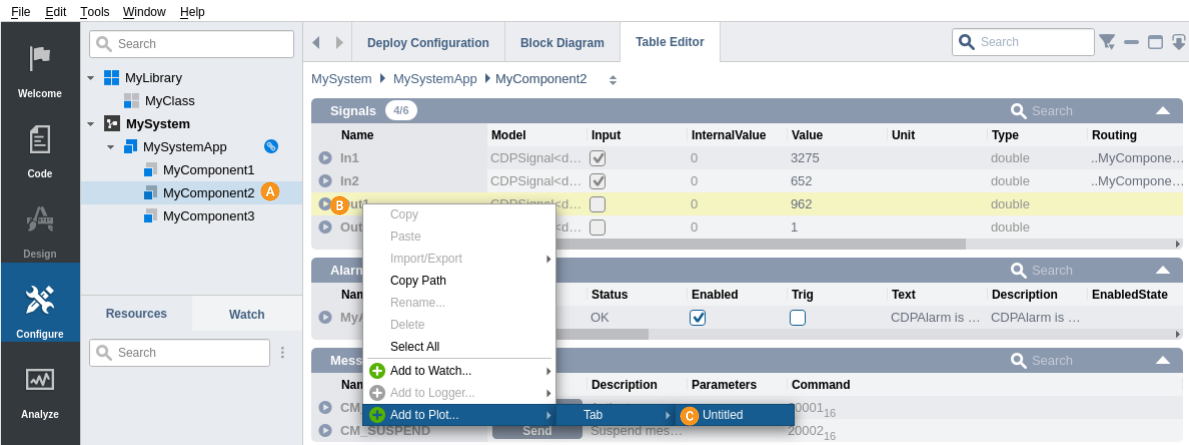
- Open Configure mode, navigate to and select the component that has the values you want to plot
- In the Block Diagram side panel or in the Table Editor, right click on the signal or property name
- Select "Add to Plot..." -> "Tab" -> "Untitled" from the context menu.
- Go to Analyze mode
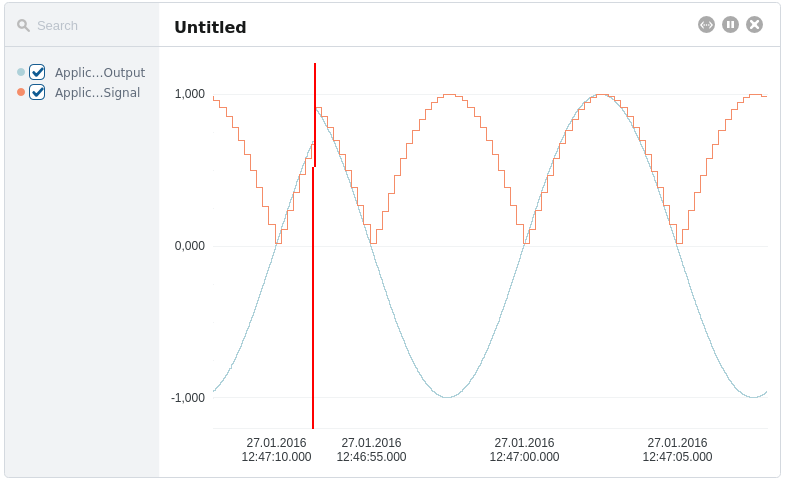
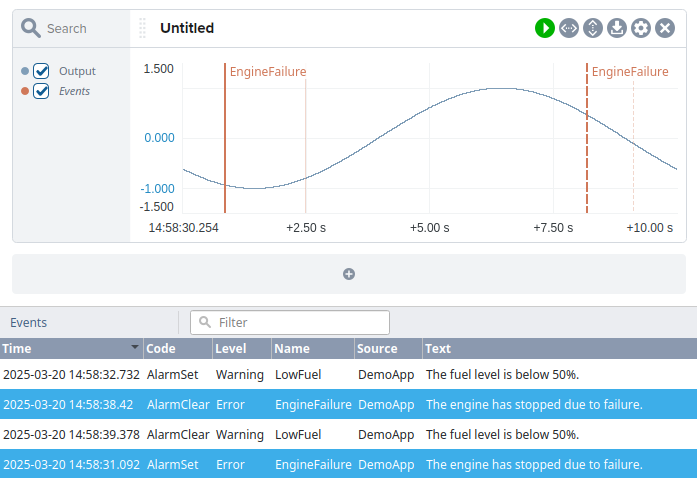
The graph shows the output from the pre-made sine component and the rectified sine wave created by the component described in the How to Create a Library.
Analyze Mode Features
In addition to plotting signals and visualizing events, CDP Studio Analyze mode offers a wide range of tools to help you inspect, fine-tune, and interact with your data efficiently.
Some of the most useful features include:
- Autofit axes: Use the "<->" button to autofit the x-axis and the vertical line button for the y-axis.
- Precise axis scaling: For the x-axis, click on the first label to set the start time and on the last label to set the time range (in seconds, time format, or units). For the y-axis, click on the max and min labels to enter custom values.
- Zoom and pan: Scroll to zoom, Ctrl+drag for box zoom, click-drag to pan, right-click to undo.
- Legend customization: Right-click legend names to set aliases or change line colors.
- Graph organization: Rename plots and tabs, reorder or move graphs between tabs, resize or hide legends, and adjust height.
- Header options: Lock, hide, or reveal graph headers using the cogwheel menu or hover interaction.
- Boolean View: Hold Ctrl and double-click a legend or header to toggle boolean graph mode.
- Signal management: Move or copy signals between plots by dragging, with Ctrl to copy.
- Event integration: Show events using the cogwheel menu and enable the synchronized event list for context.
- Cursor routing: Hold Ctrl while hovering to display full routing details in the cursor box.
For a full overview of all available features and shortcuts, see the Analyze Mode Manual.
Get started with CDP Studio today
Let us help you take your great ideas and turn them into the products your customer will love.