
Building a Condition Report with Metrics
Introduction
This example shows how a single CDP Studio application can combine a dynamic HMI, a dynamic condition-report dialog with one-click PDF export, and a tag-driven MetricsManager setup that builds per-asset KPI calculators at runtime. The application is ConditionReporter and contains two thruster components, AFT PORT and AFT STBD, together with a MetricsManager named ConditionMonitor.
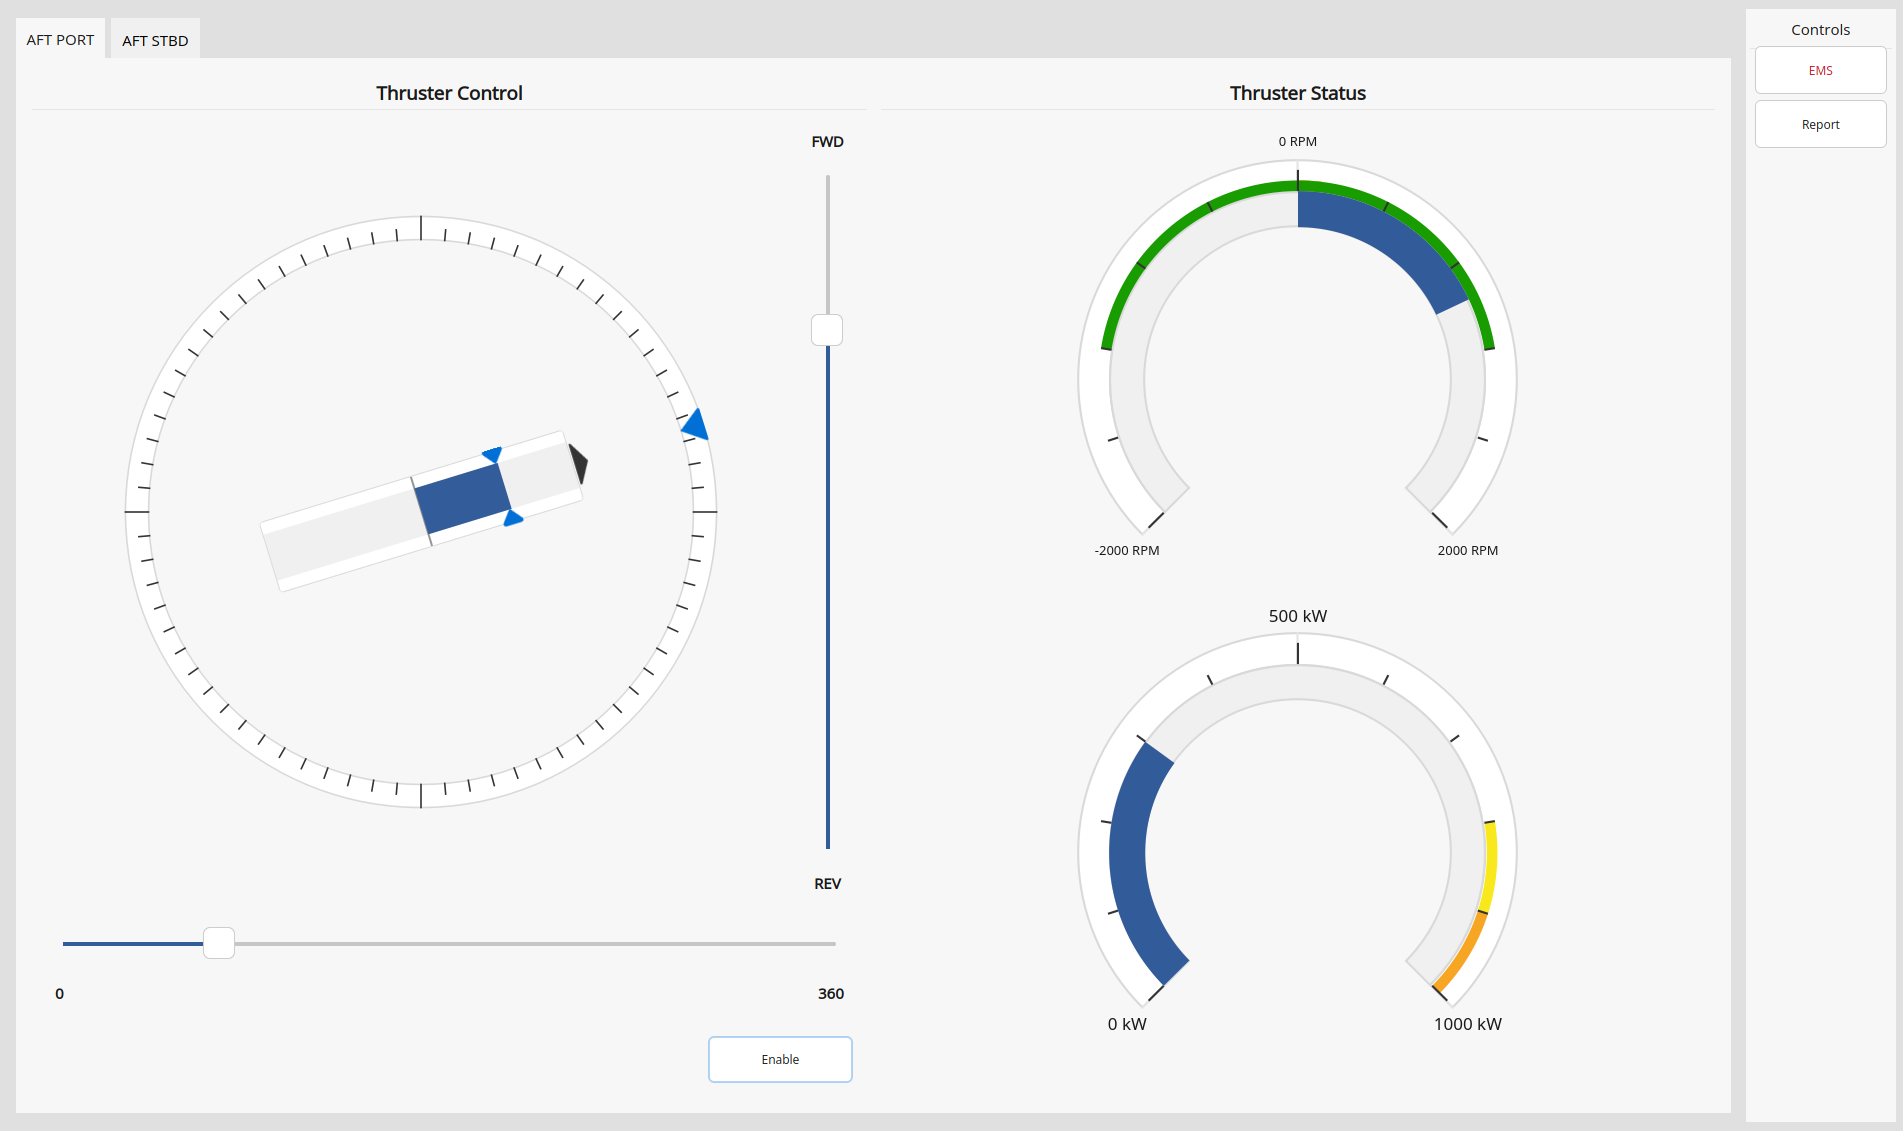
The thrusters are tagged equipment=thruster, and ConditionMonitor uses a MetricDefinition named ThrusterMetrics together with a real-time data source to build per-thruster MetricNode calculators under ConditionMonitor.MetricNodes at runtime. The same project shows both sides of the workflow: how repeated equipment is presented by a dynamic HMI, and how the same equipment is summarised by a dynamic condition report. The report dialog can be exported to PDF directly from the operator HMI by a single button click, which makes this example also a demonstration of producing shareable condition reports straight from a live automation system.
Why This Example Exists
The example demonstrates a scalable way to build operator-facing views and condition reports without hard-coding a fixed asset path. Instead, it uses:
- equipment tags to identify which components are thrusters
- signal and parameter tags to describe which values represent power, temperature, direction, speed, current, emergency stop, and engineering constants
- a MetricDefinition to define KPI recipes once
- a MetricsManager to instantiate runtime MetricNode calculators from those recipes
- relative routing and reusable
.uiforms so the same widget tree can be loaded for every matching object
This separates the process model, the KPI definition, and the presentation layer, which is one of the core ideas behind the CDP Studio metrics system. Because those three concerns are decoupled, the example scales naturally from one thruster to several.
Project Overview
The system project contains one HMI application named ConditionReporter with the following main runtime parts:
ConditionReporter.AFT PORT(CDPComponent)ConditionReporter.AFT STBD(CDPComponent)ConditionReporter.ConditionMonitor(MetricsManager)
ConditionMonitor itself contains:
- MetricNodes -- the runtime-generated KPI tree
- ThrusterMetrics -- the shared MetricDefinition recipe set
- RealtimeSrc -- a MessengerMetricDataSource for real-time metric calculation
The application also exposes a top-level EMStop signal. The main HMI binds the EMS button to ConditionReporter.EMStop.Value, and each thruster routes its own EStop signal to ..EMStop.
Tagging the Thruster Components
Both thrusters expose the same signals (Enable, EStop, ThrustCmd, AzimuthCmd, ActualThrust, ActualAzimuth, ActualRPM, Power_kW, Current_A, MotorTemp_C and similar) and share the same tag vocabulary. At component level both are tagged equipment=thruster. At signal and parameter level the example uses tags such as control=enable, control=emstop, control=fault, label=power, label=temperature, label=direction, label=speed, label=current, plus engineering tags like engineering=main_shaft_bpd and constants tagged constant=Pi. Those tags are what allow the metrics layer to discover the right inputs automatically.
How the Dynamic HMI Is Built
The HMI is intentionally split into several reusable .ui files. The top-level mainwidget.ui contains a NodeContainer configured with cdpTargetRouting=ConditionReporter, modelFilter=CDPComponent, equipmentFilter=thruster, uiFileName=thruster.ui, and childContainerName=tabWidget. The container locates the thruster-tagged components below ConditionReporter and loads thruster.ui once for each, routing the dynamically created pages into a tab widget.
thruster.ui is the reusable live view. Its top widget is a RoutingContainer, and its inner widgets use relative routings such as .ThrustCmd, .AzimuthCmd, .Enable, .ActualRPM, .Power_kW and .ActualAzimuth. Because the routings are relative, the same form is reused for both AFT PORT and AFT STBD.
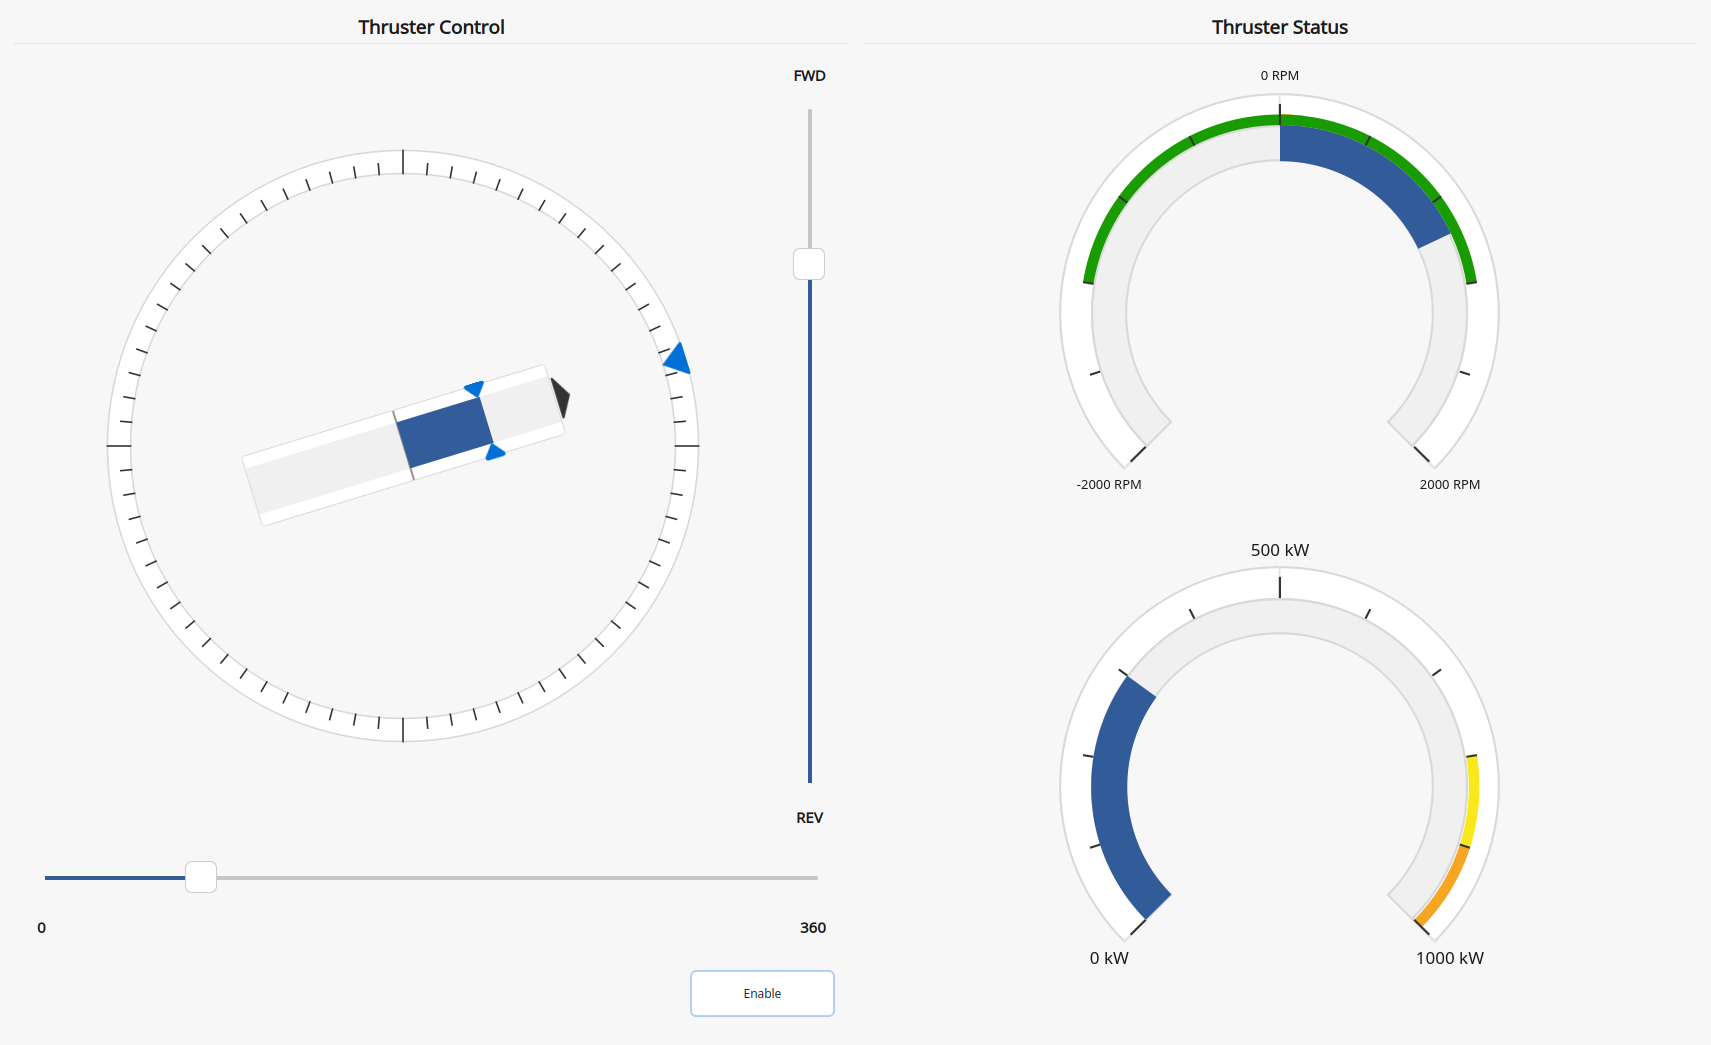
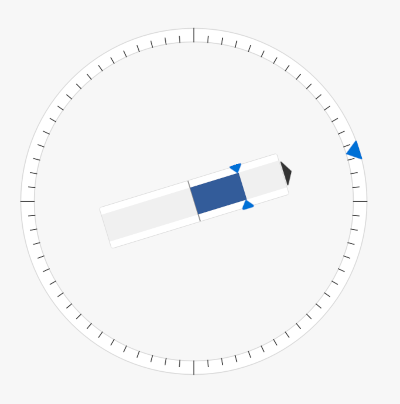
A nested thrustIndicator.ui form is itself a RoutingContainer with cdpTargetRouting=., so it inherits the current thruster instance and binds to local paths such as .ActualThrust.
The right side of the main window adds two application-level controls: an EMS button bound to ConditionReporter.EMStop.Value and a Report popup-dialog button that opens reportForm.ui.
How the Dynamic Report Dialog Is Built
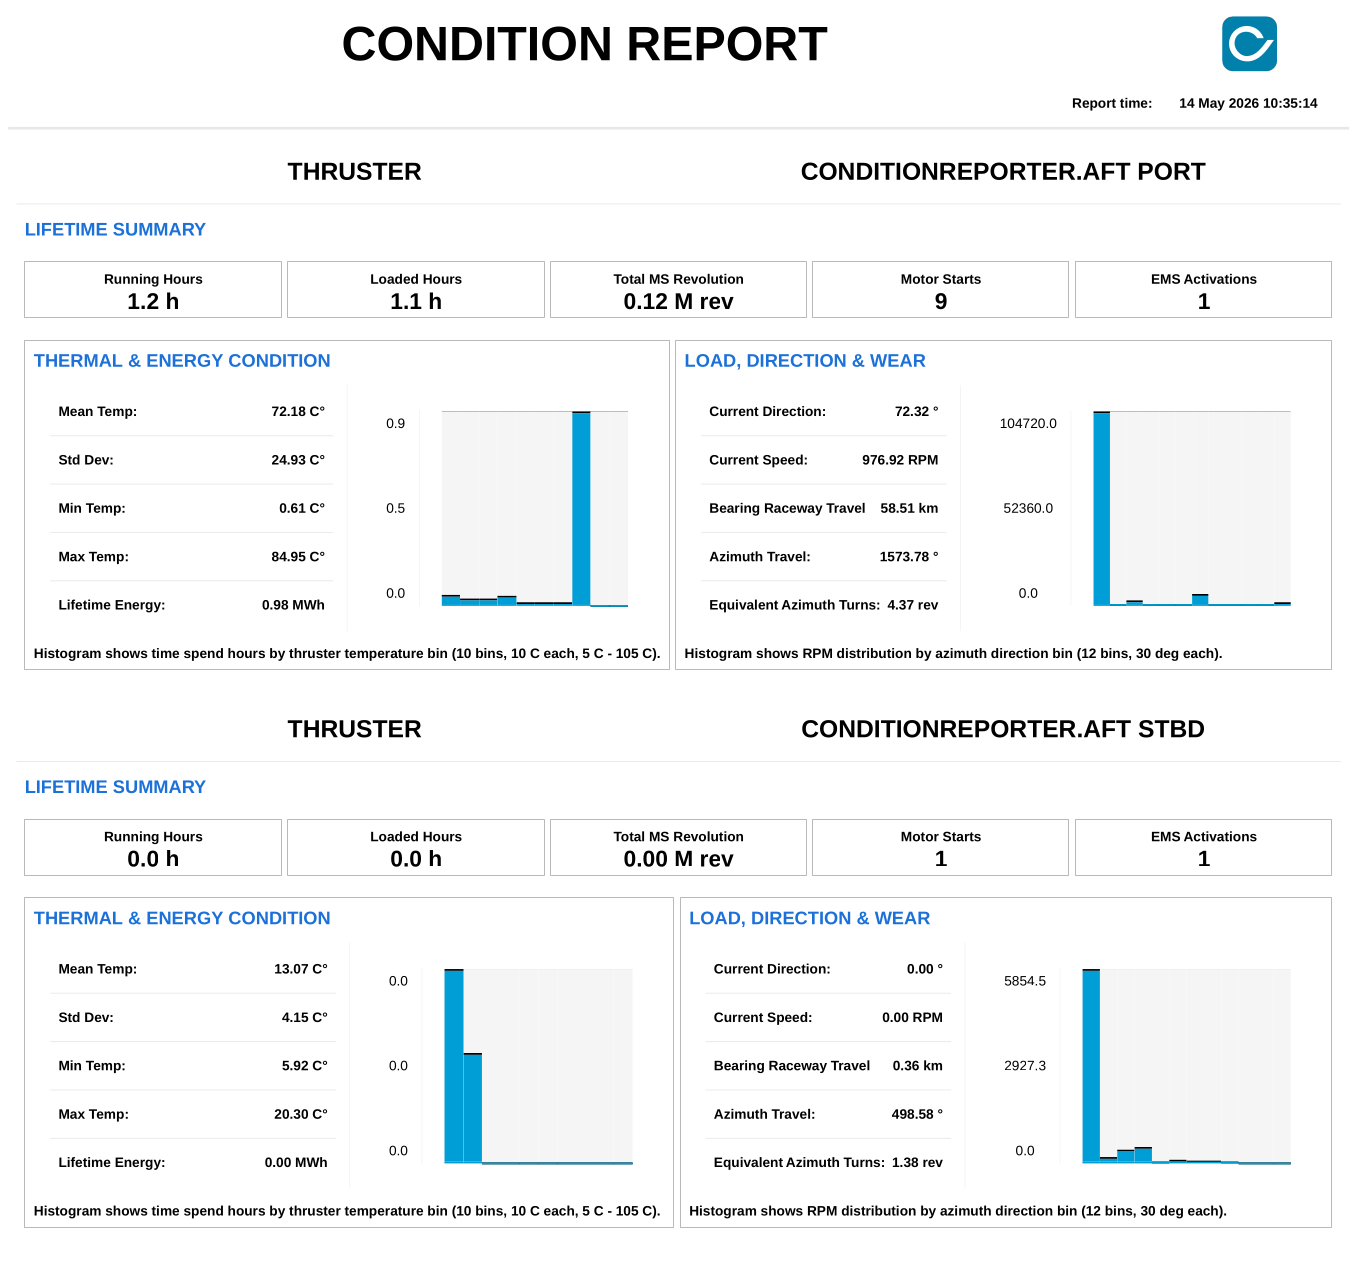
The Report button opens reportForm.ui, a CDPBaseDialog titled Condition Report. The dialog hosts a QScrollArea containing a ReportContainer, which in turn contains a NodeContainer configured with:
cdpTargetRouting= ConditionReporter.ConditionMonitor.MetricNodesuiFileName= thrusterReportCard.uiequipmentFilter= thrusterdefaultLayout= Vertical
This means the report dialog does not hard-code one section per known thruster. It reads the runtime metric tree and creates one report section per generated thruster metric folder. The ReportContainer is configured with lockedTheme=flat_light so that exported reports stay visually stable even if the rest of the HMI theme changes.
The Save PDF button is connected to reportContainer.saveAsPdf(); the container's pdfSaved(QString) and pdfSaveFailed(QString) signals are wired to a status label so the user sees either the saved file path or the error text.
How the Report Card Is Composed
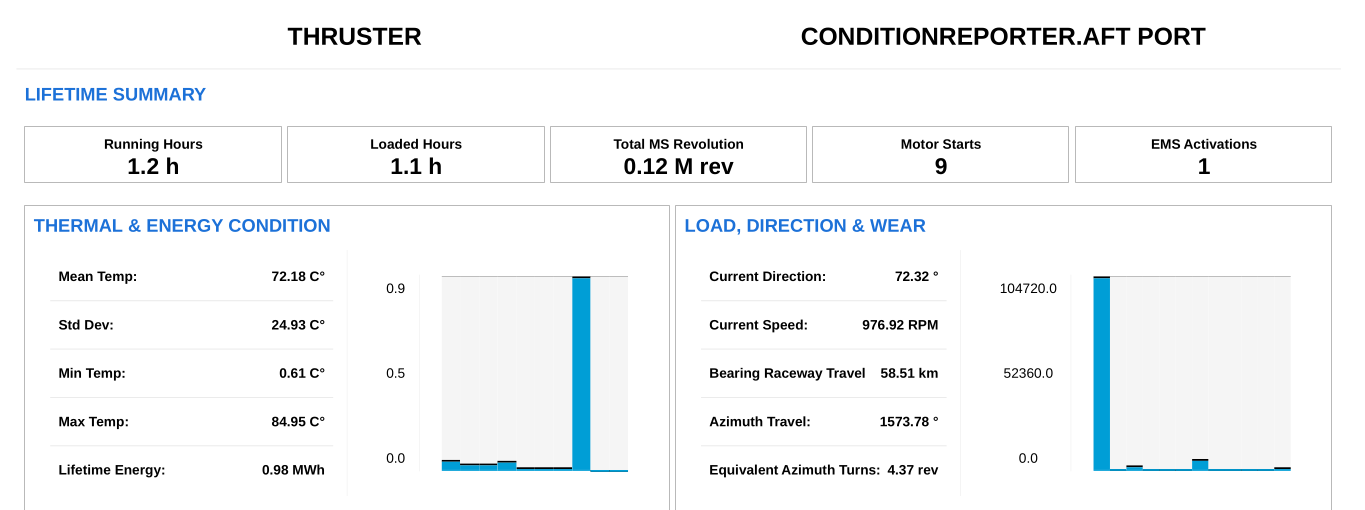
thrusterReportCard.ui is the reusable per-thruster report section. Its top-level routing is . so it can be loaded for any generated thruster metric folder. The card reads summary values directly from the runtime metric node tree using paths such as .TagPaths, .LifeTimeRunningHours.Hours, .LifeTimeLoadedHours.Hours, .TotalShaftRotations.Integral, .MotorStart.Count, .EMStop.Count, .Temperature.Mean, .Temperature.Std, .Temperature.Min, .Temperature.Max, .TotalPowerkWh.Integral, .Data.direction, .Data.speed, .MSBearingRacewayTravel.Integral and .AZTravelDegrees.SumDelta. The report is therefore based on calculated KPI results rather than raw process paths.
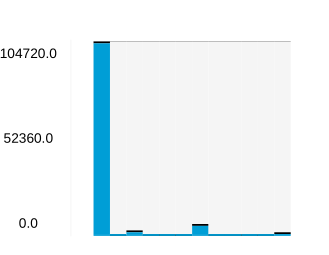
The card also contains two CDPBaseUiLoaderWidget instances -- one with cdpTargetRouting=.Temperature and one with cdpTargetRouting=.AZSpeedDirDistribution -- both of which load the same reusable file histogram.ui. The histogram.ui is itself a RoutingContainer with cdpTargetRouting=., containing a NodeContainer that filters on modelFilter=IntelligentEdge.HistogramProperty and loads histbar.ui horizontally for each bin. Each histbar.ui bar uses cdpRouting=. and maxValueRouting=..BinMax to scale itself against the parent metric node's BinMax.
How Runtime Metrics Are Generated
ConditionMonitor is configured as a MetricsManager with a MessengerMetricDataSource. The ThrusterMetrics definition uses PathFormat=equipment, CountedTags=equipment and CountFormat=%d, so the runtime tree under ConditionMonitor.MetricNodes becomes:
thruster1--TagPaths=ConditionReporter.AFT PORTthruster2--TagPaths=ConditionReporter.AFT STBD
The TagPaths mapping keeps it clear which runtime KPI folder belongs to which source asset.
ThrusterMetrics contains 11 metric definitions: EMStop, MotorStart, LifeTimeRunningHours, LifeTimeLoadedHours, TotalPowerkWh, Temperature, AZSpeedDirDistribution, TotalShaftRotations, MSBearingRacewayTravel, AZTravelDegrees and Data. They tell two stories at once: a lifetime story (starts, emergency stops, running hours, energy, rotations, accumulated travel) and a current/statistical story (current direction, current speed, temperature statistics with distributions). TotalPowerkWh, TotalShaftRotations and MSBearingRacewayTravel use Equipment.ProductIntegratorMath as custom metric math. MetricNode and metric state are persisted by the runtime metric system, so the metrics layer itself maintains the lifetime totals.
Observing Results at Runtime
After running the system:
- The main HMI creates one tab per thruster-tagged component, each loaded from the same
thruster.uiform, with controls acting on relative routings for the selected instance. - Under
ConditionReporter.ConditionMonitor.MetricNodesthe example creates two runtime foldersthruster1andthruster2; each folder points back to its source asset throughTagPathsand contains the KPI nodes generated from ThrusterMetrics. - The Report dialog creates one report card per generated thruster metric folder, with histogram sections built from nested reusable
.uifiles, and supports export to PDF from the dialog.
How to Run the Example
To run the example from CDP Studio, open Welcome mode and find it under Examples. Next, in Configure mode right-click on the system project and select Run & Connect. See the Running the Example Project tutorial for more information.
The recommended way to experience the dynamic HMI and the dynamic condition report is to run the example twice. First, run it as shipped to see the HMI tabs, the runtime metric nodes under ConditionReporter.ConditionMonitor.MetricNodes, and the report dialog with its PDF export. Then stop the system, and -- back in Configure mode -- add a third thruster by copy-pasting one of the existing thruster components in ConditionReporter and renaming the copy to, for example, BOW so it acts as a bow thruster.
No other changes are needed. Run the system again and observe:
- the main HMI gains a third thruster tab loaded from the same reusable
thruster.uiform, because the NodeContainer inmainwidget.uisimply discovers one more match forequipmentFilter=thruster - a new
thruster3folder is generated underConditionReporter.ConditionMonitor.MetricNodeswith itsTagPathspointing at the new component, because the MetricsManager instantiates one MetricNode set per countedequipmenttag value - opening the Report dialog now renders a third report card automatically from
thrusterReportCard.ui-- including its histogram views -- and the Save PDF button exports a report that covers all three thrusters
This is the recommended hands-on way to confirm that nothing in the HMI or in the report is tied to a specific asset path: the new bow thruster appears everywhere just by virtue of carrying the right tag.
See also Calculating MTBF with Metrics, MetricsManager, MetricDefinition, and MetricNode.
Get started with CDP Studio today
Let us help you take your great ideas and turn them into the products your customer will love.