Intro 2: Tutorial of Using REST IO
Intro 2: Tutorial of Using REST IO
This tutorial gives you an introduction to how to connect to hardware/automation I/O or external services using IOServer function blocks, to build systems by connecting blocks and using mathematical functions, and all this can be done without any coding. How we use the configuration is a key concept that is important to understand in CDP Studio, the independent automation software for open PC-based real-time distributed control systems.
This tutorial shows:
- What is possible to do with configuration
- How to connect and configure/build a system
- How to connect external information or physical IO to a CDP project using IOServers
- Add pre-made mathematical functions
This project gets weather data for Oslo, the capital of Norway, and displays the temperature in Celsius and Fahrenheit.
This is the step-by-step guide to creating the example Intro 2: Setting Up IO for REST. The project files are found in the Examples section in Welcome mode
By completing the tutorial, you will have been through the steps to use IOServers and pre-made mathematical functions.
Recommended: See first Intro 1: Connect Variables to HMI GUI.
Project Overview
The project connects to OpenStreetMap to get the position of Oslo. It then connects to an Internet weather service using the position to collect the weather. Fahrenheit is calculated from the Celsius temperature using operators. The temperatures are shown in a simple GUI.

The example uses REST as no physical hardware is required and will therefore work for all users. The same principle applies to industrial protocols such as MQTT, MODBUS, CANopen etc. In this example, an ExternalControlBroker (a pre-made IOServer, see also Definitions) has been added to the WeatherDataApp from the Resources section in Configure mode.
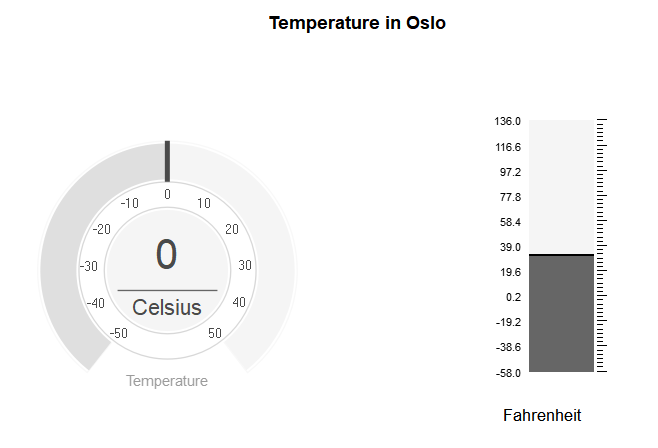
The temperature in Celsius is shown on the meter (Meter widget), in Fahrenheit in the bar (bar widget) and "Fahrenheit" is written using the text label widget.

Some concepts are important to understand when developing with CDP Studio. Below is useful information related to this example.
The process to create a CDP system is:
- Select the pre-made or existing resources/function blocks (items that exist in the Resources section in Configure mode)
- Develop any missing resources/function blocks
- Design the GUI
- Create the system by connecting the resources/function blocks together and to the GUI
This example covers steps 1, 3 and 4. The development of resources/function blocks/components is covered in the Intro 3 where libraries are introduced.
The development process shown above may differ from other tools. An important concept to understand is that CDP systems are created by connecting available components/function blocks/GUI together and by adding mathematical functions (operators). This is done without any coding. Coding is only done when developing new function blocks or mathematical functions.
When you have the required reusable components created, you may create advanced and comprehensive systems without any (or only a small amount) of coding.
In this example, only existing components and operators are used. The system is built ('configured' in CDP terminology) by routing (connecting) the blocks together and then routing these to the GUI.
Creating the System and Application
The first step in making a CDP project is to create a system and an application.
Create a system named WeatherServiceTutorial using the pre-selected CDP Framework version, and make sure to add a GUI application called WeatherDataApp. For details on creating a system, see How to Create a System.
CDP Studio comes with many pre-made resources. Some of these are IOServers that are used to communicate with hardware and external systems. This tutorial uses the ExternalControlBroker to get information from web services, a JSON query operator to extract information from the data returned from the web services and mathematical operators to calculate the temperature in Fahrenheit.
This tutorial primarily uses the Block Diagram and this gives a good visual view of the system as we create it. The Block Diagram is very good when it comes to creating systems with many components and routing (connecting) the components together. The Table Editor can also be used and is efficient to use when changing many values.
Get Oslo City Information And Extract The Position
To get the temperature for Oslo, we need first to find Oslo’s position. OpenStreetMap provides a service that allows you to get the longitude and latitude of a city. We need to send an HTTP request to OpenStreetMap internet service and extract the position from the JSON string that is returned.
Get The Oslo City Information From OpenStreetMap
To send HTTP requests (REST) and receive the answer, we use the function ExternalControlBroker. To add the ExternalControlBroker:
- In Configure mode select WeatherServiceTutorialApp from the Project tree. The Resource tree is now populated with ready-made objects to choose from
- In the Resource tree, expand ExternalControlIO
- Locate ExternalControlBroker and double-click on it to add it to the WeatherDataApp
The ExternalControlBroker is now added to the application.
- Click on the Block Diagram tab to select the Block Diagram
- Click on the ExternalControlBroker and change the name in the property list on the right side of the screen to GetOsloPosition
Now we have to add an HTTPRequest function to the ExternalControlBroker and a string variable to contain the answer from OpenStreetMap.
- Double-click on the ExternalControlBroker to navigate into the component
- In the Resource tree, expand ExternalControlIO
- Add a HTTPRequest and change the name to OsloPositionQuery
- Select the HTTPRequest block (single-click)
- In the URL field set the HTTP request to: https://nominatim.openstreetmap.org/?addressdetails=1&q=oslo&format=json&limit=1
- OpenStreetMap requires that you also set the AuthMethod to "AnyExceptBasic" and UserAgent to a text, e.g. "CDPStudio Weather tutorial"
- In the Resource tree, expand ExternalControlIO and then ResponseSignalChannel
- Add a ResponseSignalChannel<string> and rename it to CityInformation
- Deselect everything by a single-clicking on the background
- Add a CDPSignal<string> (under CDPCore->CDPSignal) and rename it to CityInformation
- Connect the CityInformation on the OsloPositionQuery block to the CityInformation signal
The HTTPRequest function will send the request to OpenStreetMap and the answer will be inserted into CityInformation in a JSON format. A CDPSignal (variable) is added to the GetOsloPosition block to easily use the variable containing the JSON answer in the system.
Extracting The Longitude And Latitude
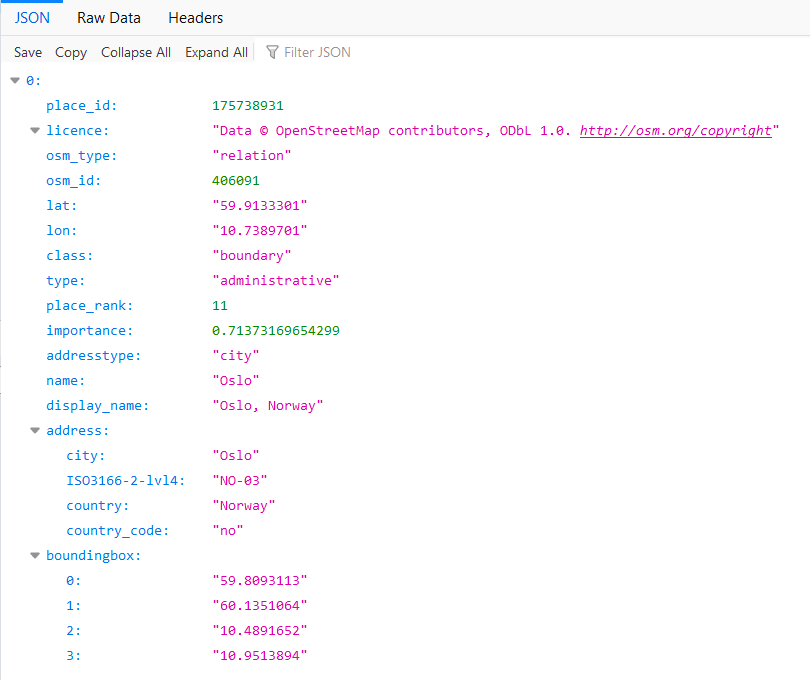
The JSONQuery function extracts information from a JSON formatted string and can be used to extract Longitude and Latitude. The JSON string returned by OpenStreetMap is:

The JSONQuery extracts 1 value from the JSON string by specifying the complete tree and the name of the variable. OpenStreetMap returns a simple answer with 2 levels. To extract the longitude, you need to specify "/0/lon".
Note: In the Resource tree, there is a search field and this is a fast and easy way to find available resources.
Extracting the Longitude:
- Click on the WeatherServiceTutorialApp in the Project tree to go to the application level
- In the Resource tree, enter json in the search box and add the JSONQuery
- Rename it to ExtractLongitude
- Connect the GetOsloPosition.CityInformation to the ExtractLongitude.In
- Select (single-click) ExtractLongitude and enter "/0/lon" in the Query field to extract the longitude
Add another JSONQuery using the same steps as above. Call it ExtractLatitude and set the query to "/0/lat".
The "Out" signals now contain the longitude and latitude of Oslo.
Get The Weather Information For A Given Position
The weather data is collected from Norwegian Meteorological Institute. They provide worldwide weather forecasts based on the position specified in the HTTP request.
The process of building this is similar to getting the position, but now we need to use variables (longitude and latitude) as part of the HTTP request. The function will then be able to get the forecast for any position worldwide.
Get The Weather Forecast For Any Position Worldwide
First, create a new ExternalControlBroker that has 2 input variables:
- Create a new ExternalControlBroker and name it GetPositionWeather
- Double-click on the GetPositionWeather block
- Add 2 variables (signals), from the Resource tree expand CDPCore->CDPSignal and add 2 CDPSignals<double>
- In turn, click on the signals and check the "Input" checkbox and rename them to Longitude and Latitude
- An output signal is also required for the weather forecast, add a CDPSignal<string> and rename it to Forecast (input not checked)
A block with inputs and outputs is now created. Now, the actual HTTP request must be added with longitude and latitude as inputs and the forecast as output. The inputs are of type RequestSignalChannel and the output is of the type ResponseSignalChannel.
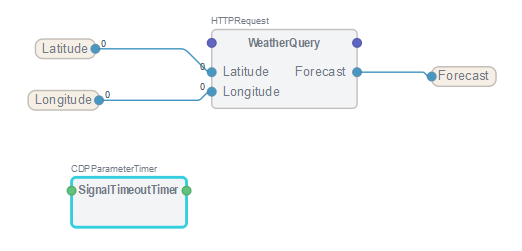
- Add a HTTPRequest and rename it to WeatherQuery
- Single-click on the WeatherQuery block
- From the Resource tree, add 2 RequestSignalChannel<float>
- Select the request channel by single-click on the name and rename the first to Latitude
- Repeat the above step for the second and rename it to Longitude
- Now add a ResponseSignalChannel<string> from the Resource tree and rename it to Forecast
- Select the WeatherQuery block
- Set the URL to https://api.met.no/weatherapi/locationforecast/2.0/compact?lat=%1%&lon=%2%
- Set the AuthMethod to "AnyExceptBasic" and UserAgent to a text, e.g. "CDPStudio Weather tutorial"
The values in the RequestChannels can be dynamically inserted into the HTTP request (the url). The values are referred to in the order they appear in the list. The first is referred to as %1%, the second as %2% etc.
To finalise this configuration, you need to connect the variables.
- Connect (route) the signal Latitude to Latitude on the WeatherQuery block
- Similarly, connect Longitude and Forecast signals to those on the WeatherQuery block
- Navigate up to the application level (double-click on the background or select the WeatherServiceTutorialApp in the Project tree)
- Connect the Out on the ExtractLatitude box to the Latitude on the GetPositionWeather box
- Connect the Out on the ExtractLongitude box to the Longitude on the GetPositionWeather box

The Forecast contains the weather forecast in a JSON format.
Extract The Temperature From the Forecast
The string returned from yr.no is more complex as it gives a forecast for different time periods. The JSON query to extract the current Celsius temperature must take the added levels into account. Paste https://api.met.no/weatherapi/locationforecast/2.0/compact?lat=59.913330078125&lon=10.738969802856445 in a web browser to see the string returned by yr.no. Firefox decodes the JSON string and displays it in the easy to read way as you see above. The query to extract the current Celsius temperature is "/properties/timeseries/0/data/instant/details/air_temperature"
- Add a JSONQuery and rename it to ExtractTempCelsius
- Set the Query to /properties/timeseries/0/data/instant/details/air_temperature
- Connect the Forecast on GetPositionWeather to ExtractTempCelsius.In
The ExtractTempCelsius.Out now contains the temperature in Celsius.
Calculating The Temperature in Fahrenheit
The formula F=C*1.8+32 converts the temperature from Celsius to Fahrenheit. This is a simple maths operation, and we will use the multiplication (MUL) and addition (ADD) operators. These can be added to the application level directly, but then it is more difficult to understand the system. We will therefore create a Celsius to Fahrenheit function.
- At the application level, add a CDPCore->OperatorContainer
- Rename it to CtoFConverter
- Go into the CtoFConverter block
- Add 2 CDPCore->Arguments->Arguments<double>
- Rename 1 to Celsius and make it an input
- Rename the other one to Fahrenheit (make sure the input is not checked)
- Add an Automation->Multiply->Multiply<double>
- Add an Automation->Add->Add<double>
- Select the Mul operator and set the In1 = 1.8
- Select the Add operator and set the In1 = 32
- Connect Celsius to the Multiply.In0
- Connect Multiply.Out to Add.In0
- Connect Add.Out to Fahrenheit
- Go up to the application level and connect ExtractTempCelsius.Out to CtoFConverter.Celsius
Creating the Graphical User Interface (GUI)
GUIs are made in the CDP Studio Design mode and CDP Studio comes with a large set of pre-made widgets. This tutorial uses the Meter widget (classical gauge) to show the Celsius temperature and the Vertical Bar widget to show the temperature in Fahrenheit. Both widgets can be extensively styled and customised, but in this example, we only use some basic styling.
Follow the steps below to create the GUI:
- Go to Configure mode and select WeatherDataApp in the Project tree. The Design mode is now selectable
- Click on Design mode to go into the GUI editor
- In the resource list to the left, find the widget named Meter and drag it into the Form editor
- Adjust the size and place it on the left-hand side in the Form editor
- Select the Meter in the form by clicking on it
- In the Properties window, set the following properties: minValue=-50; maxValue=50; textPrefix=Celsius; textSuffix=Temperature; numPrecision=0; cdpRouting= WeatherServiceTutorialApp.ExtractTempCelsius.Out
- Find the widget named Vertical Bar and drag it into the form, resize and place it to the right of the Meter
- Select the Vertical Bar in the form by clicking on it
- In the Properties window, set the following properties: tickPos=TicksBelow; numPos=NumbersAutoLeft; minValue=-58; maxValue=136; cdpRouting=WeatherServiceTutorialApp.CtoFConverter.Fahrenheit
- Find the widget named Label and drag it into the form, resize and place it under the Bar
- In the Properties window, set the following properties: text=Fahrenheit
How to Run the Tutorial
To run the tutorial from CDP Studio, select Configure mode, right-click on the system project and select Run & Connect. See the Running and Connecting to the System tutorial for more information.
Inspect Real-time Info and Plot Values
A very useful feature is the possibility to see, in real time, all values in the table format and to plot values changes in a graph. This is very useful when testing, analyzing, tuning and searching for possible issues in a system.
After selecting Run & Connect, you will be connected to the running system. Select a component in Configure mode and you will see that the values change in real-time.
Visualizing the values in a graphical plot is done in Analyze mode as is described in the Analyze Mode Manual.
Get started with CDP Studio today
Let us help you take your great ideas and turn them into the products your customer will love.